


The world is producing fascinating data at an unprecedented pace, on subjects ranging from air quality in Chicago, to the economics of healthcare, to tattoo trends in the NBA. Hidden in this data is a wealth of insights. We're not uncovering them fast enough.
We started Mode last August to make data analysis more open and collaborative. We believe that, when empowered to work together, analysts can significantly speed up how quickly we learn from data. Today, we open Mode to public beta.
The backstory
The best analysts we know approach their work—and that of others—with a never-ending supply of questions. They often want to understand how data was collected, how it would look if viewed from a different angle, or what story it would tell if combined with other data. Great analytical work not only answers questions, but inspires more.
Yet, most of these questions go unanswered. The burden of sharing the data sources, work, and code behind an insightful analysis is just too great. And if an analyst does strike out on her own to build upon an existing piece of work, she’s forced to start from scratch.
These “do-overs” exist everywhere. Analysts within companies aren’t building upon and learning from the works of their colleagues because it’s hard to know what’s been done before. Companies constantly reinvent analyses rather than adapting tried-and-true methods to their needs. People around the world are working with similar data sets but aren’t connected enough to push their collective knowledge further, faster. What if we could empower each other to skip straight to the unsolved problems, the unanswered questions?
Introducing Mode
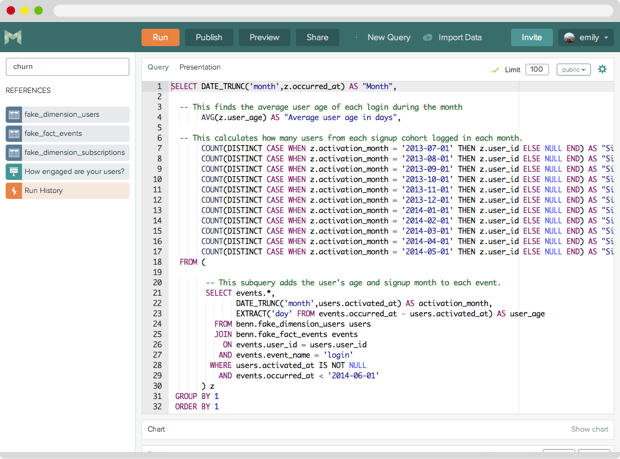
Mode is a web-based tool that combines SQL (R and Python to come!) and visualization editors with publishing and discovery tools. It executes analysis, displays results, and renders visualizations in one place. In doing so, we’ve made insights and the underlying work more shareable, discoverable, and reproducible.
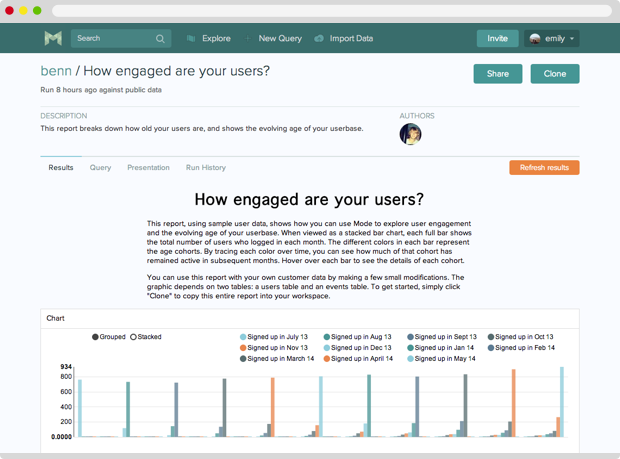
Simply click Clone on any report, and you’ll be working with the same data, query, and code published by the original author, exactly where she left off. When work is cloned, the original author maintains credit and can see how you’re building upon her work.
Mode makes it easy to reference others’ work while creating your own. As you write, you can search for reports and data and “pin” them as references. You can also build visualizations without ever leaving the browser. Your entire project lives at a URL that you can share or embed anywhere on the internet, providing easy access to the work behind the insights. We also offer private workspaces for companies or groups of people collaborating on analysis of proprietary data.
Stand on the shoulders of giants
Today’s launch is just the beginning. There’s a lot more to build before our mission—to connect the world’s data and the people who analyze it—is complete. We’re looking forward to seeing the great work people build with Mode—and perhaps more importantly, what we can learn from each other.
Click “a la Mode” in the embedded graphic below to get started.

