


When trying to understand a data set, analysis often starts broad and narrows as you go. SQL is perfect for pulling the broad data set and writing initial filters. But, when it comes to summarizing data, it can be faster to calculate aggregations with pivot tables.
Exporting a data set into Excel for pivoting disconnects the analysis from its source, making it hard to replicate in the future. Keeping a pivot table's underlying data up to date requires a lot of repetitive exporting and set up. It's time that could be better spent on new analysis.
Using Mode's brand new pivot tables, you can now explore data sets more quickly. You'll skip complex CASE statements and tedious exporting. Sharing an always-up-to-date pivot table for someone else to explore on their own is instantaneous.
Mode pivot tables in action
Let's say your sales team wants to analyze sales performance for the past year. You build a report that explores performance by region. The dashboard provides the broadest view of performance across the sales team, and shows that Midwest sales are lagging behind the other regions.
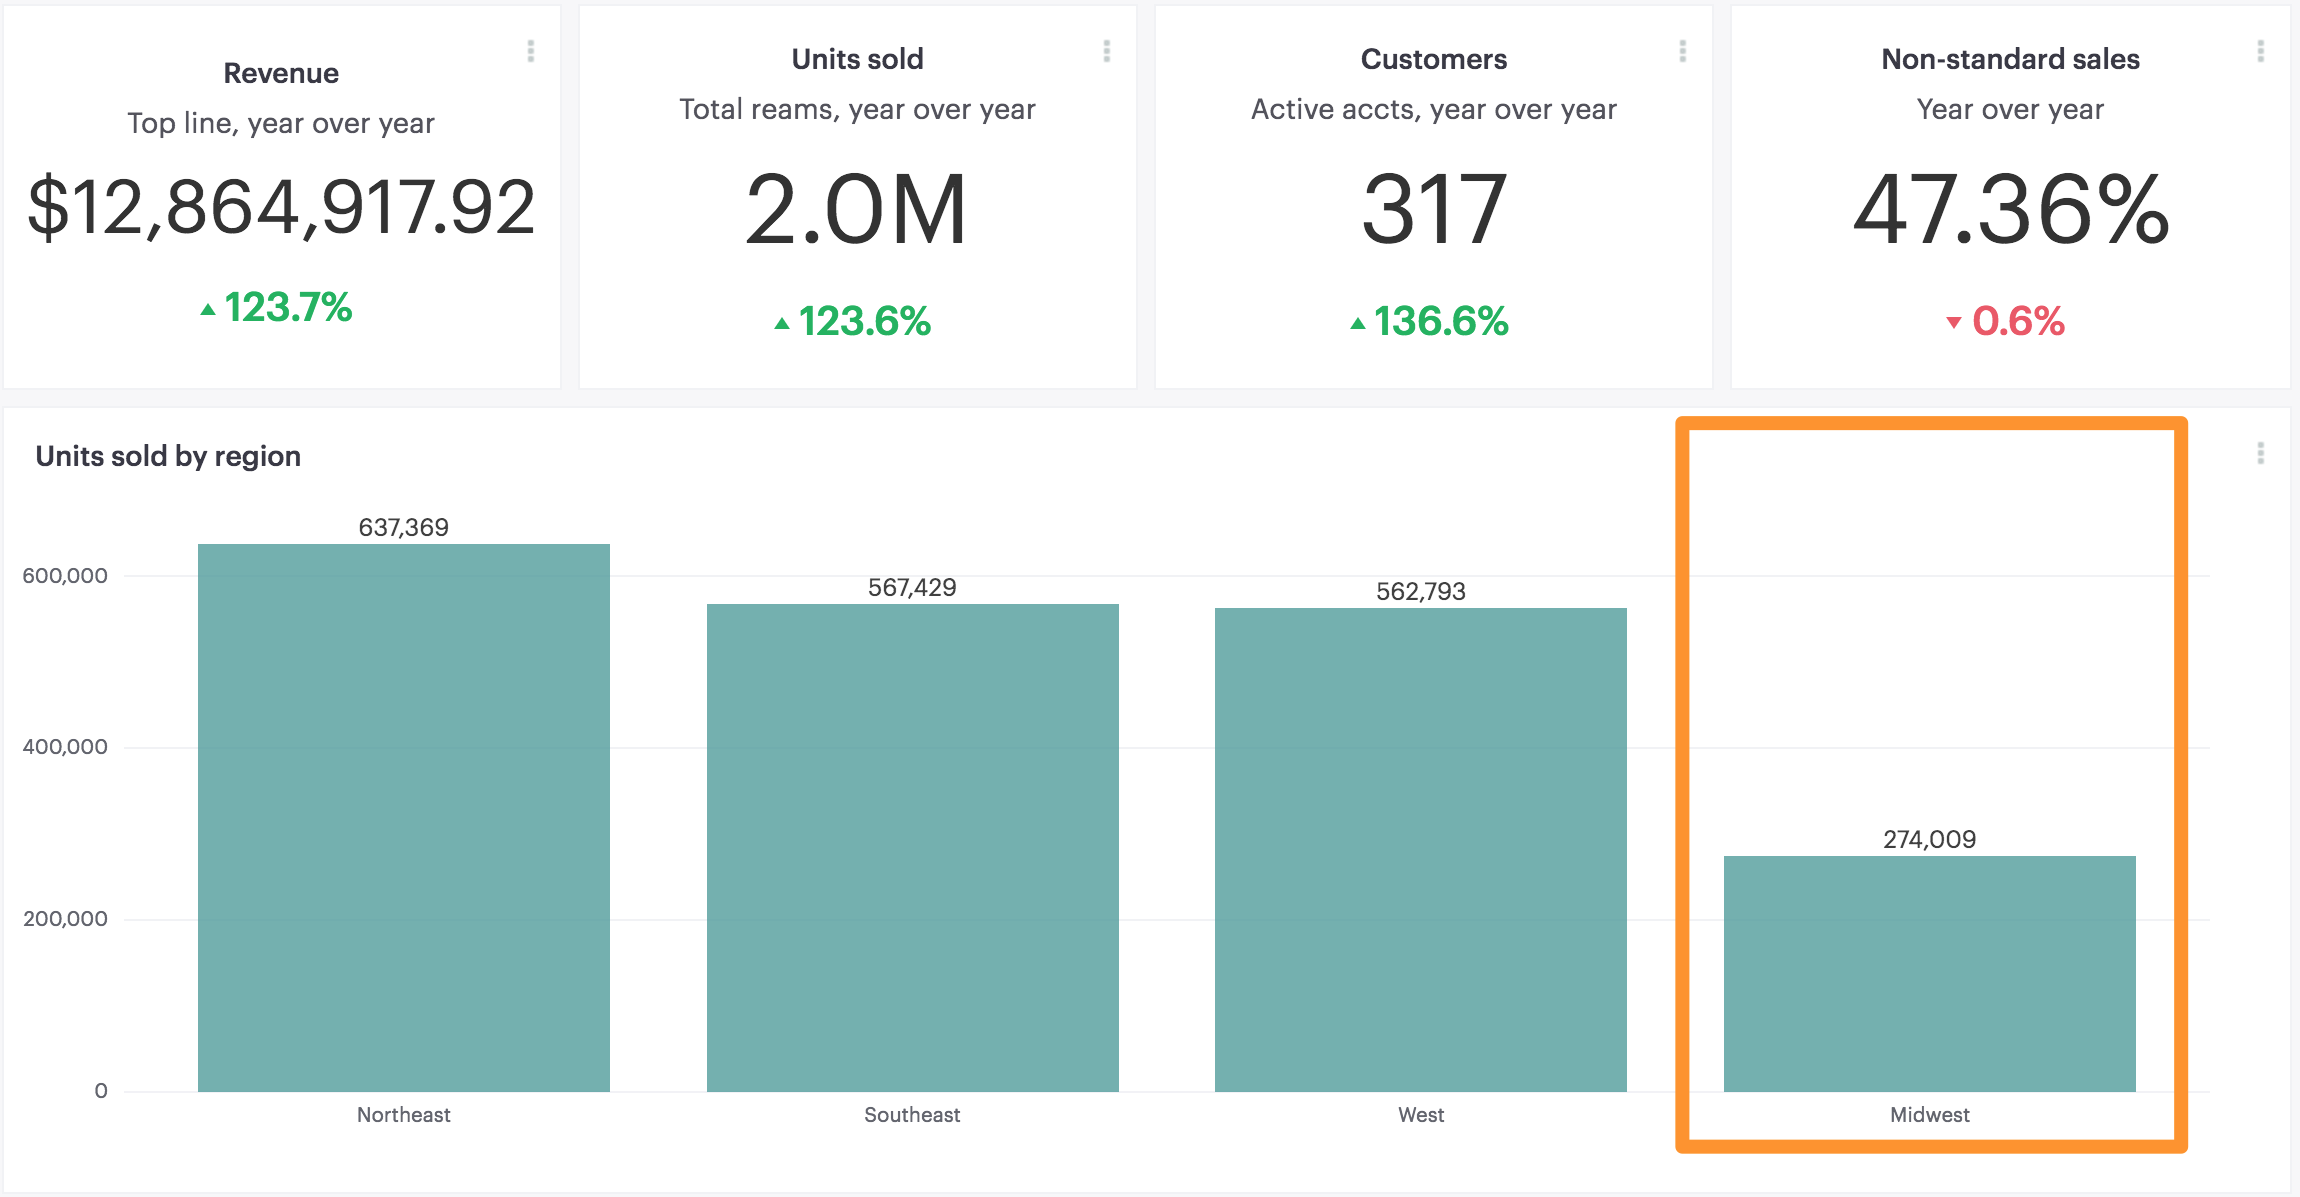
You know the questions you'll hear next. Can we see a breakdown of sales by product--maybe the new features aren't resonating in the Midwest? Are our reps there underperforming? Is something seasonal going on?
Rather than writing repetitive queries, with complex aggregations, and sharing them with your Sales Director one by one, you can now include a pivot table with the report. She can then explore some initial questions on her own, before roping you back in for a deeper dive.
After exploring the embedded pivot table below, you'll find what the Sales Director in this example already knows. Many of her Midwest reps didn't start until mid-2016. With the pivot table connected to the underlying sales data, she can quickly check in on their monthly performance at any time, ensuring the region keeps on pace to reach their target.
Adding pivot tables to your reports
Adding a pivot table to your report is as simple as adding a chart. After writing and running your query, click “Add Pivot Table.”
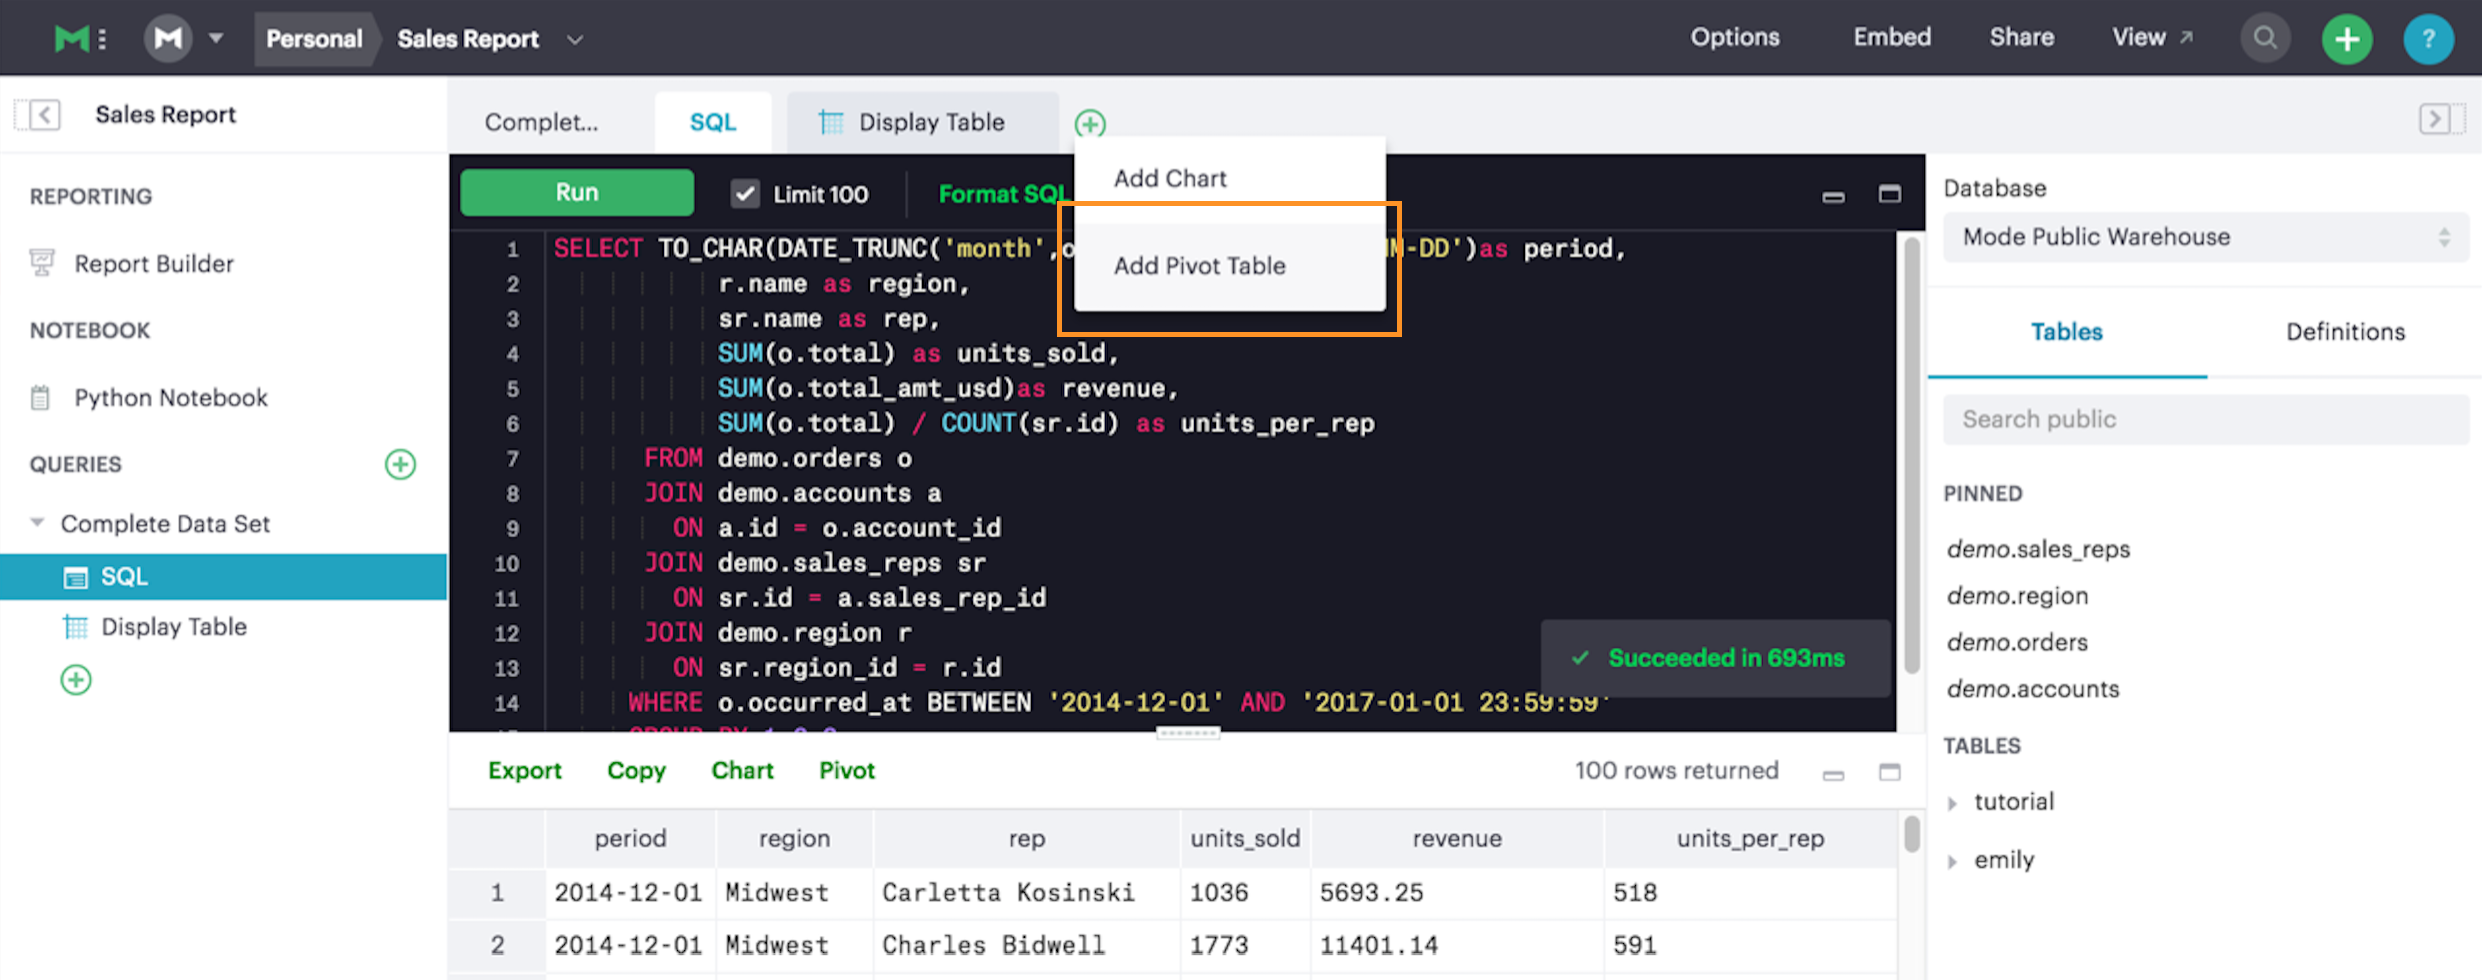
You'll find the columns from your SQL query results are available as fields in the pivot table menu. Drag and drop the fields to set your columns and rows, and to choose the value you want to display. You can create nested rows by dragging multiple fields into the rows quadrant, starting with the broadest dimension.
When you share the report with your teammates, they can customize the pivot however they like. Once the report is refreshed, the pivot table will snap back to the defaults you set in the editor.
Dive right in
Starting today, pivot tables are live for everyone. Jump in and try it out! If you have questions or feedback on this new feature, be sure to start a chat with us in the product, or reach out to us at hi@modeanalytics.com. We're excited to continue making the pivot table experience incredible for everyone using Mode.

