


Like the analysts who use Mode day-in and day-out to answer some of the hardest questions a business can throw at them, we hammer on our product for hours, every day. We're explorers, trying to make sense of data and telling stories once we do.
On the quest for why, analysts create many iterative queries and charts to inspect a problem from every angle. And just as important as the final few angles that worked are the 17 tried along the way. Keeping track of all this work can get a bit unruly.

Until now.
After months of designing and building, talking with customers, and dogfooding new features while conducting our own internal analyses, we're thrilled to introduce you to the all-new Mode. It's designed to better support deep exploration, making it easier for you to deliver more comprehensive data stories while staying organized. Check it out:
The multi-query editor
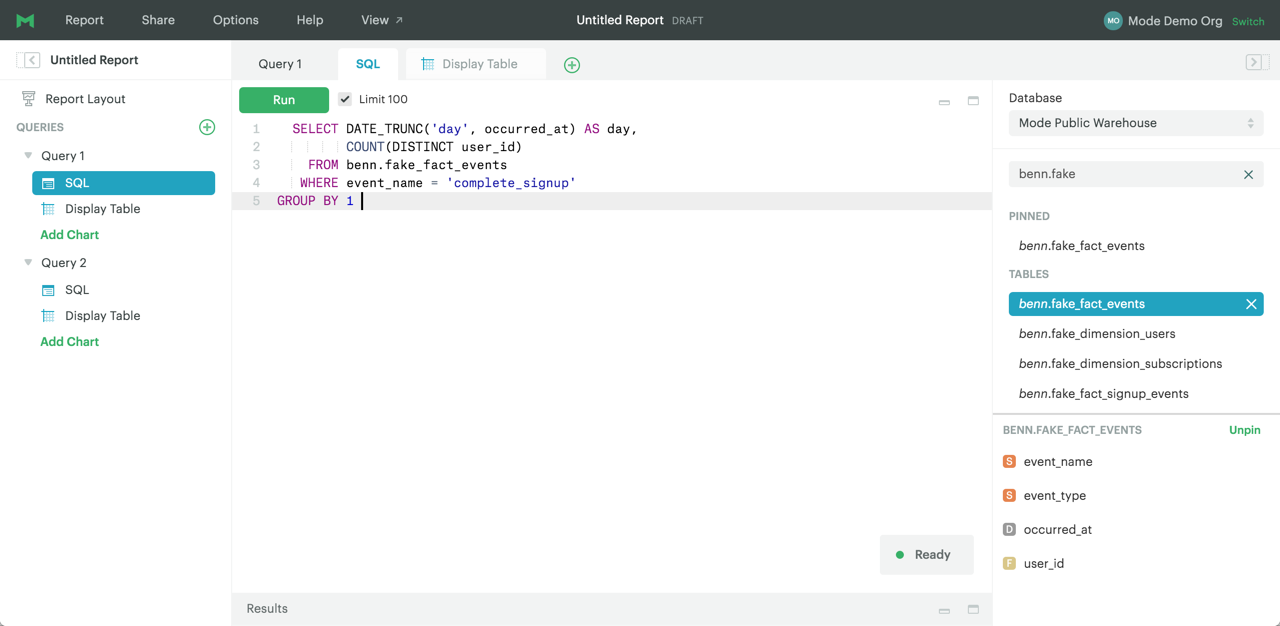
As of today, Mode reports can contain multiple queries. Rather than doing your scratch work and explorations in a series of browser tabs, you can keep all the work for one project organized together.
To add all this new functionality without overwhelming you, we updated much of the design, making menus and actions more consistent throughout the entire product.
All of the report-level functions like Save, Publish, and Share are organized into drop-down menus in the top navigation bar. Throughout the editor, we've condensed navigation and built collapsible panels in order to deliver the biggest, cleanest full-screen SQL editor ever.
The schema browser moved over to the right to make room for the new navigator panel on the left that keeps your queries and charts nicely organized.
To add a new query, hit the green plus button next to “Queries.” If you're just changing something simple—like switching DATE_TRUNC from day to week—hover over the query name and click the three vertical dots (the “shish kebab”) to duplicate and edit, rather than rewriting the whole thing from scratch.
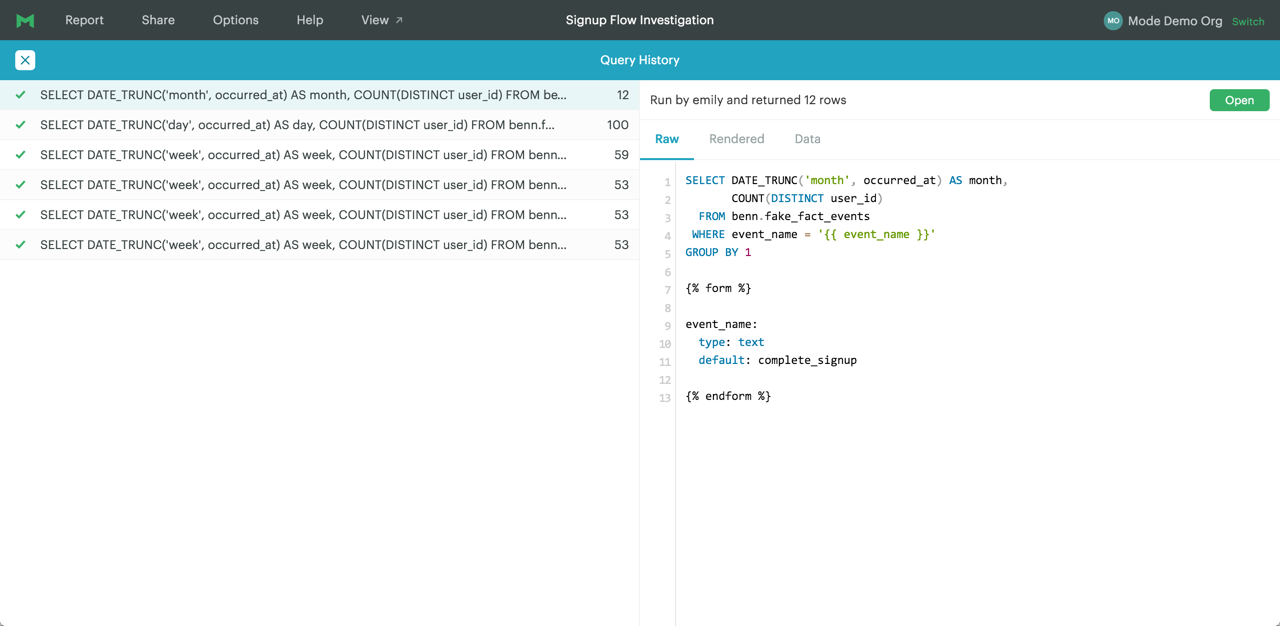
Detailed query history
Query history has always been a fan favorite. This release takes it to a whole new level. To access a query's history, select “View History...” from its shish kebab menu. A new panel will open to display each and every run, and the number of resulting rows. If your query has parameters, you can also toggle between the raw or rendered query to make trouble-shooting easier.
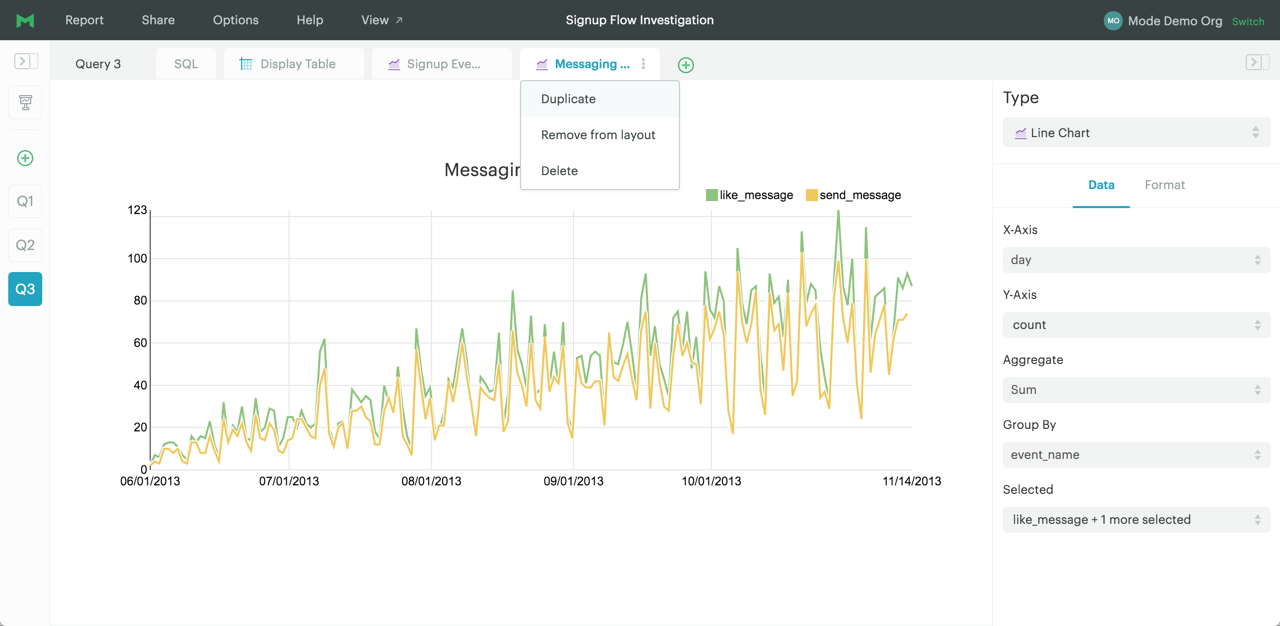
Integrated charting
We took the chart builder out of the overlay window to help you get around in fewer clicks. For an even larger view of your chart, try collapsing the left sidebar. You can use the tabs at the top to navigate between the query and its charts.
And just like queries, you can duplicate charts in a click. This makes it much faster to make iterative charts with column reference variations or tweaked axes.
Over the past few weeks we've rolled out chart improvements in anticipation of this launch. Be sure to check out the new Bar+Line chart type and try the new color palettes (including one designed to more be readable by folks with color blindness).
More flexible report builder
When you're ready to put together a report of your findings, open up the Report Layout. Here, you can pick and choose the elements to present. All of your scratch work lives on (accessible from the navigator), enabling you to deliver a final, concise answer, without losing the path to it.
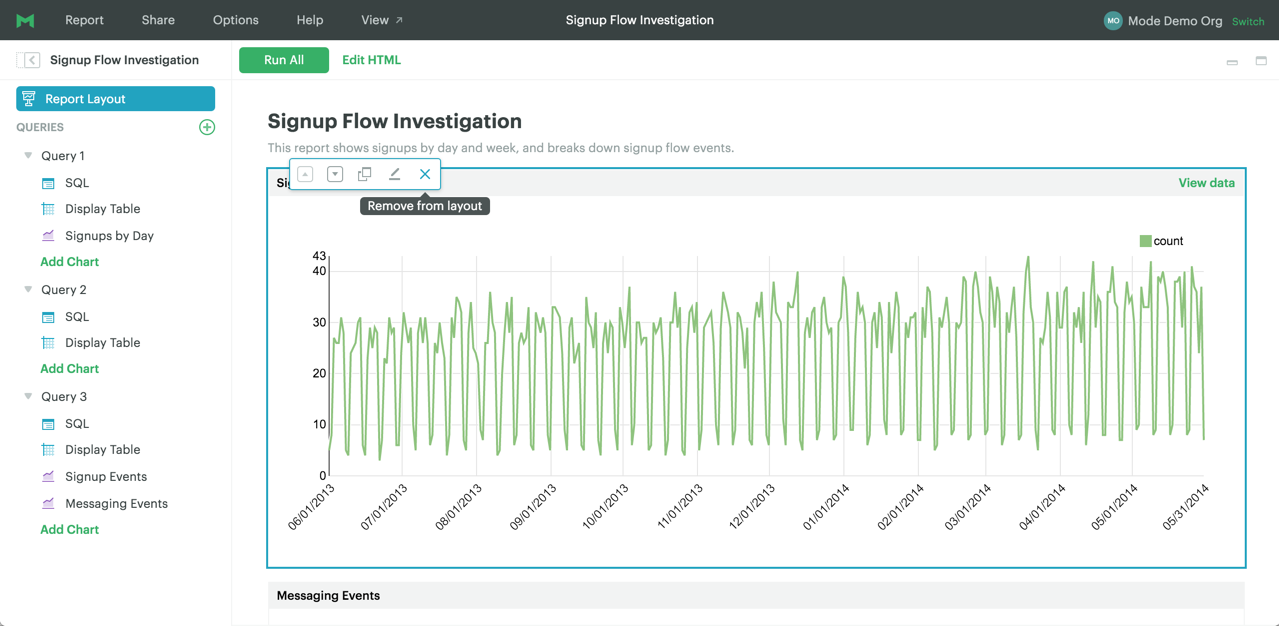
For folks who like to roll their own charts and custom visualizations, the results of all the queries are immediately available in a JSON object.
Fresh report view, too
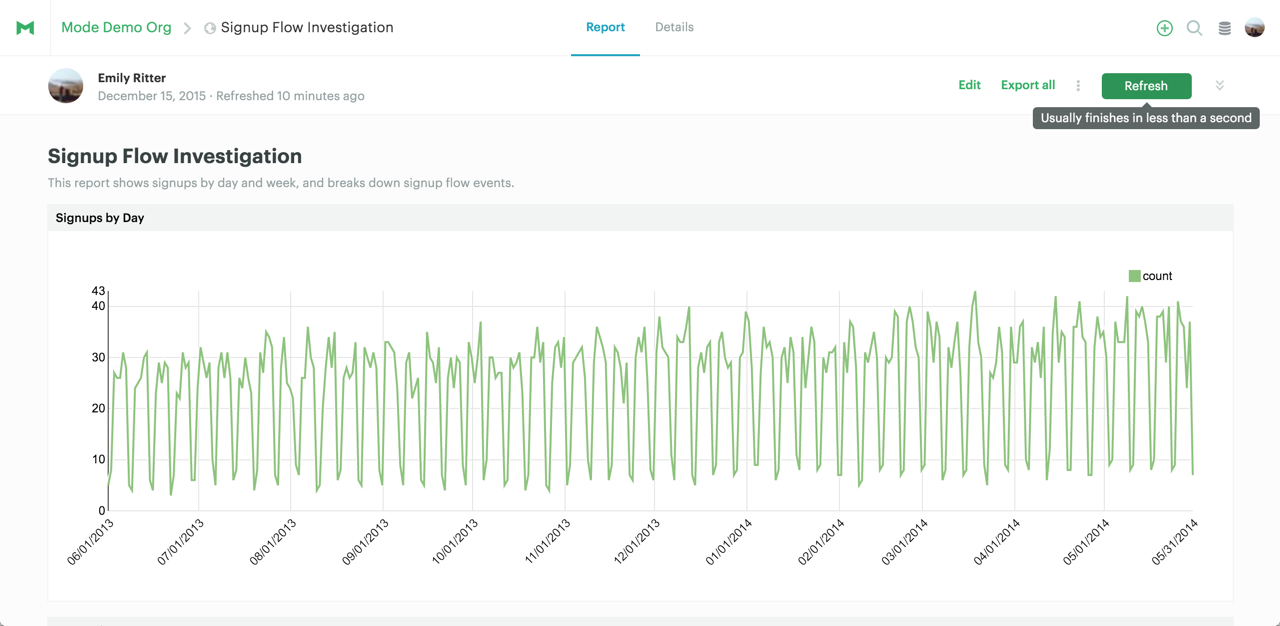
Report viewers have a lot to be excited about, too. We've freshened up the report layout to put your data's story front-and-center. Use the links at the top to switch between the report view and all the supporting work. To jump straight to the details or export the results from a specific chart, hover over it and click “View data” in the upper right corner.
Return of the Jeditor
Fun fact: this is the third big branch dedicated to significant editor improvements. When we started the project, we called the branch “Jeditor”—as in Return of the Jeditor. It was on Monday that we realized the fortuitous timing of the launch.

So there you have it, folks. We're excited to hear what you think of the new Mode. As you dive in, don't hesitate to ping us on chat with questions and feedback. Happy holidays and may the force be with you!

