


Lars Kamp is the Co-Founder & Chief Data Engineer at intermix.io where he helps customers optimize Amazon Redshift and their analytics queries for peak performance. We’ve invited intermix.io to share a guest piece detailing the new data stack.
The Modern Data Stack
In the past few years, we’ve seen a rapid shift to a “new” or “modern” analytics stack, built around cloud warehouses like Amazon Redshift, BigQuery and Snowflake. This stack has three layers:
- A data integration layer that ingests raw data from the source into a staging area in the warehouse.
- A transformation layer that takes the raw data, runs models and materializes the models into tables and views.
- An application layer, with a modern BI product like Mode for discovery and visualization, and other tools that serve data to other systems (ie for machine learning applications).
On AWS, the stack looks like this:
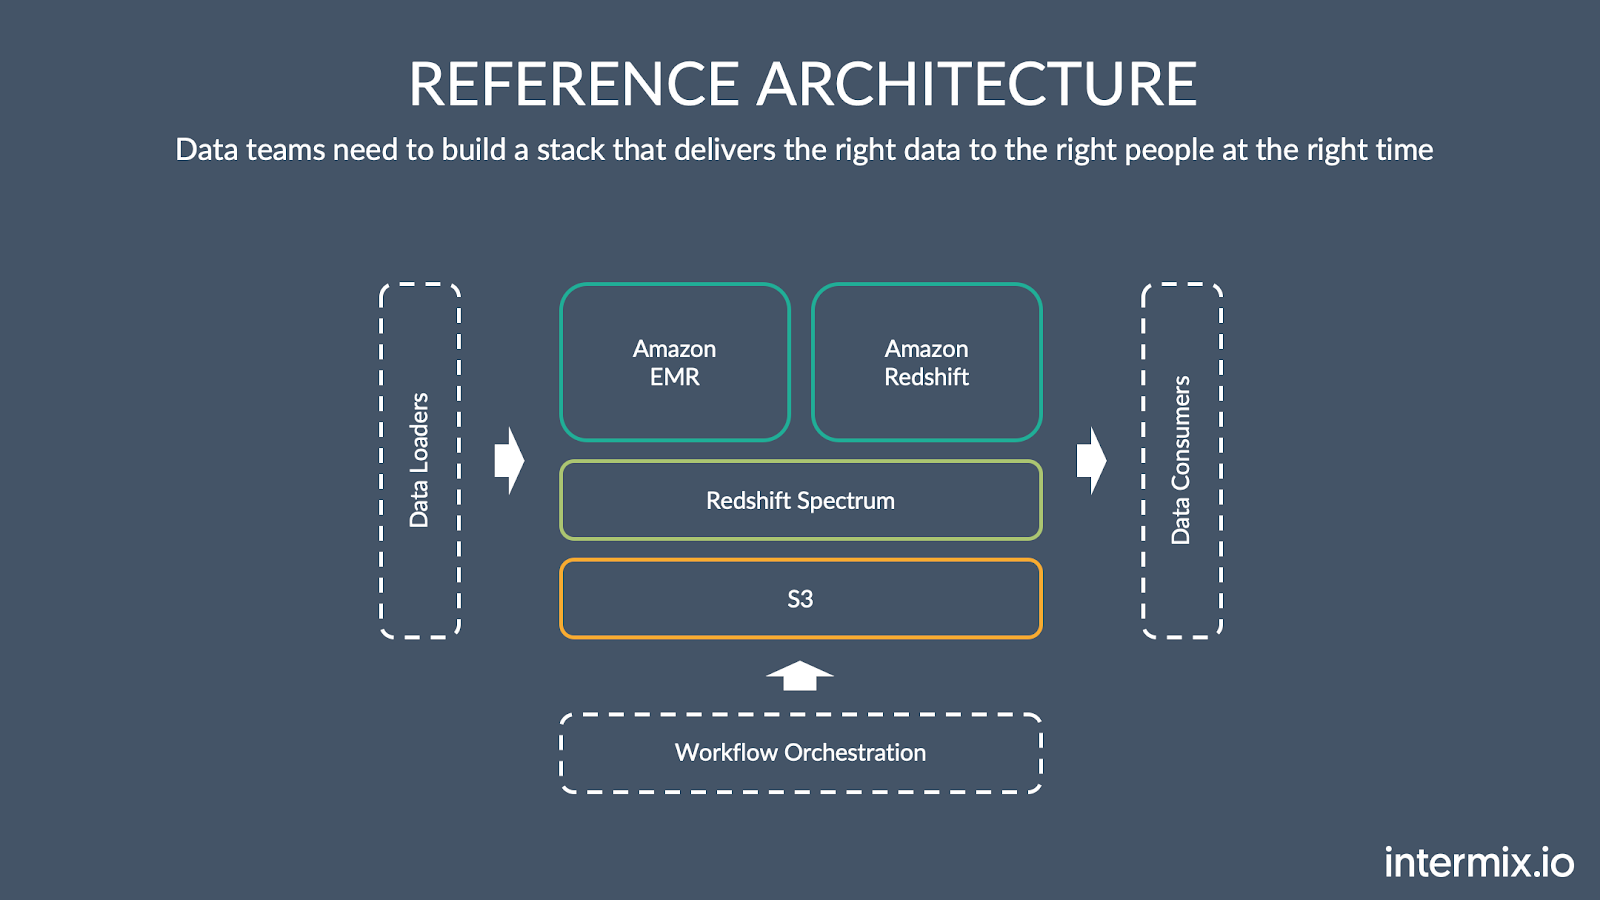
It’s a shift away from the “old” world of a monolithic on-premise warehouse stack, which is in accelerating decline. Cloud warehouses offer simplicity, performance and scalability. They handle terabytes of data and large-scale transformations across billions of rows.
New Challenges
Companies using this new stack deal with three growth challenges:
-
Data volume is growing, by a factor ~10x over 3-5 years, with more and new types of data sources emerging along the way.
-
The number of models is growing. As you ingest more data into your warehouse, you can combine that data in infinite new ways.
-
The number of users who write queries is growing. Data is becoming useful for more and more people and departments within the organization - we’ve seen teams grow the number of query authors from 20 to over 200 within 18 months.
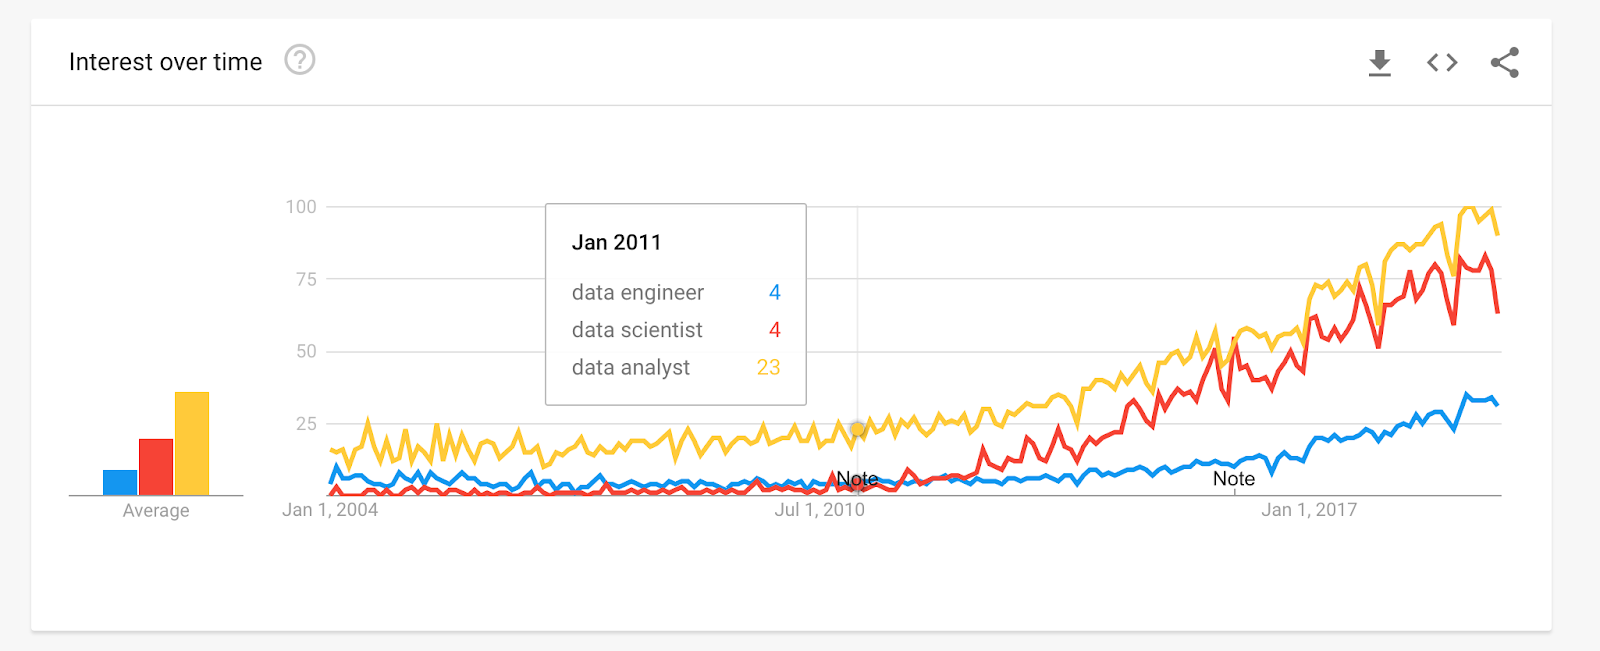
At the same time, the ratio between data engineers and data analysts/scientists is increasing. A single data engineer must support several query authors.
This leads to an increase in the number of “data support” tickets related to performance, data availability, and reporting. And it usually falls to the data engineering teams to resolve these tickets. We’ve seen teams that handle hundreds of data support tickets per -week- with a team of 3 data engineers.
Performance Becomes Mission-Critical
Data engineers are under pressure to deliver an SLA for query performance and data availability, all while supporting a growing number of analysts and query authors. And while everyone writes queries - not everyone writes good SQL!
On Amazon Redshift, expensive and long-running queries result in:
- Data pipeline jobs take longer == overall data recency goes down
- Query authors spend more time waiting == slower velocity for data science projects
- More needs for CPU and Storage == increased costs
At intermix.io, we’ve seen rogue queries that fill up a 40-node Amazon Redshift cluster with a cross-join of two 10-billion row tables, knocking out workflows and reports for the other 150 dashboard users on a Monday morning.
The net result is a lot of finger-pointing between data teams and analysts. Data teams get inundated by requests on Slack or support tickets - “what’s up with our dashboards?” It’s a process that wastes everybody’s time, causes frustration and decreases confidence in working with data.
If that sounds familiar - we’ve got a solution.
Mode and intermix.io: Better Together
intermix.io is a performance management for data teams to optimize their Amazon Redshift cluster for cost and performance. It helps teams spot problems before they turn into fire drills. It gives teams a single view of every tool, user, and query that touches the data in your cloud warehouse.
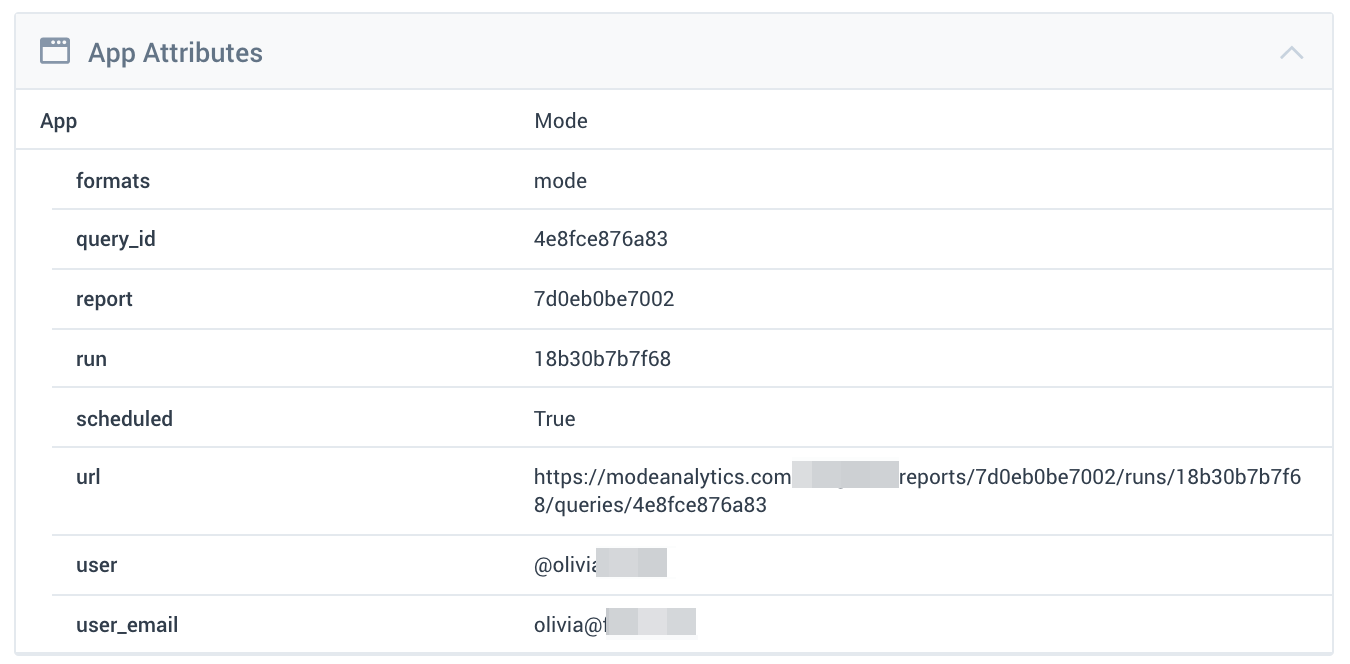
The intermix.io Mode integration used SQL query introspection to detect Mode queries. Mode embeds a comment block in each query with rich metadata about each individual query, and intermix.io introspects the Mode queries to parse the annotations and index them as first-class labels in our product.
The result is rich visibility into Mode reports, runs, queries, and users.
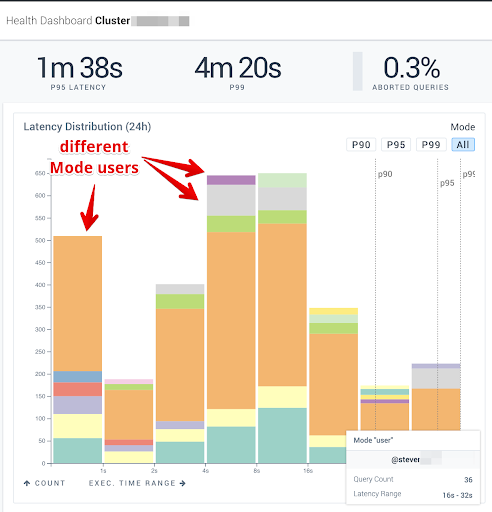
Measure & Improve SLAs
The intermx.io dashboard makes it easy to see the P95 SLA you are providing to Mode users, and quickly drill into the users who are running expensive queries.
Improving SLA metrics requires a two-pronged approach:
- Optimize the Amazon Redshift cluster resources
- Find and optimize the slowest & most resource-intensive queries
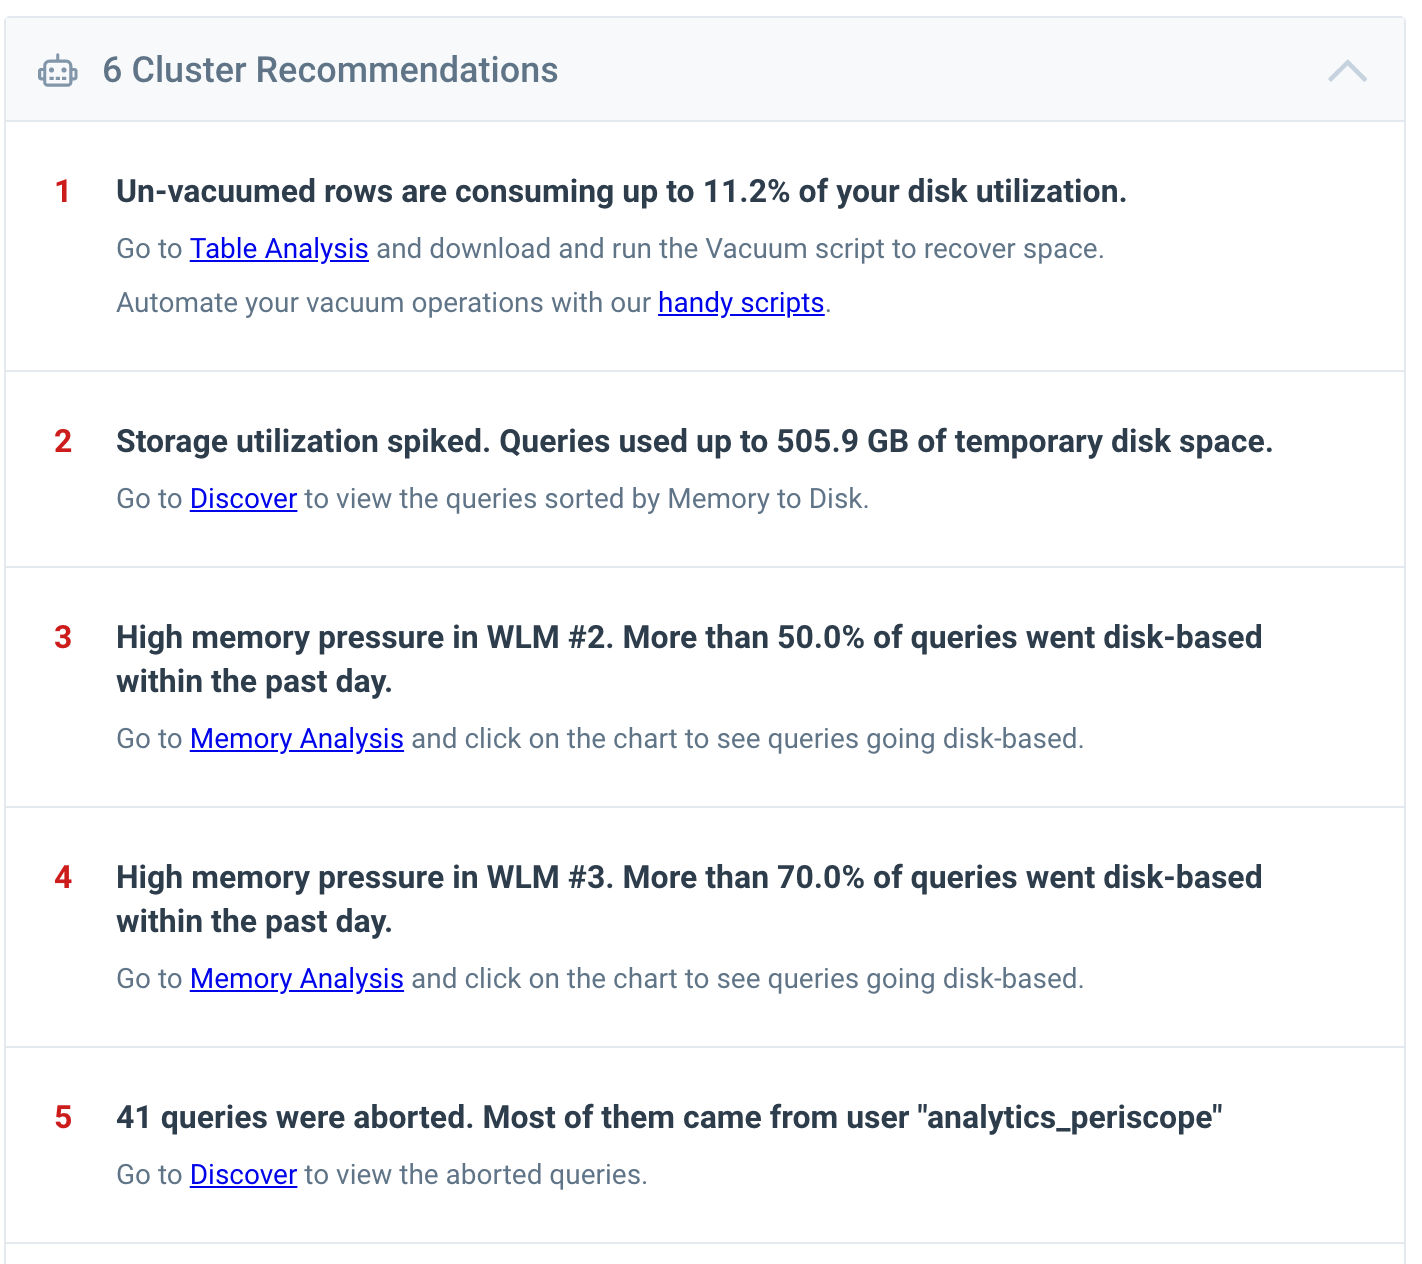
Cluster Recommendations
Managing a large-scale Amazon Redshift cluster requires ongoing management of storage, memory and concurrency utilization. The intermix.io dashboards surface timely & actionable recommendations on what to do.
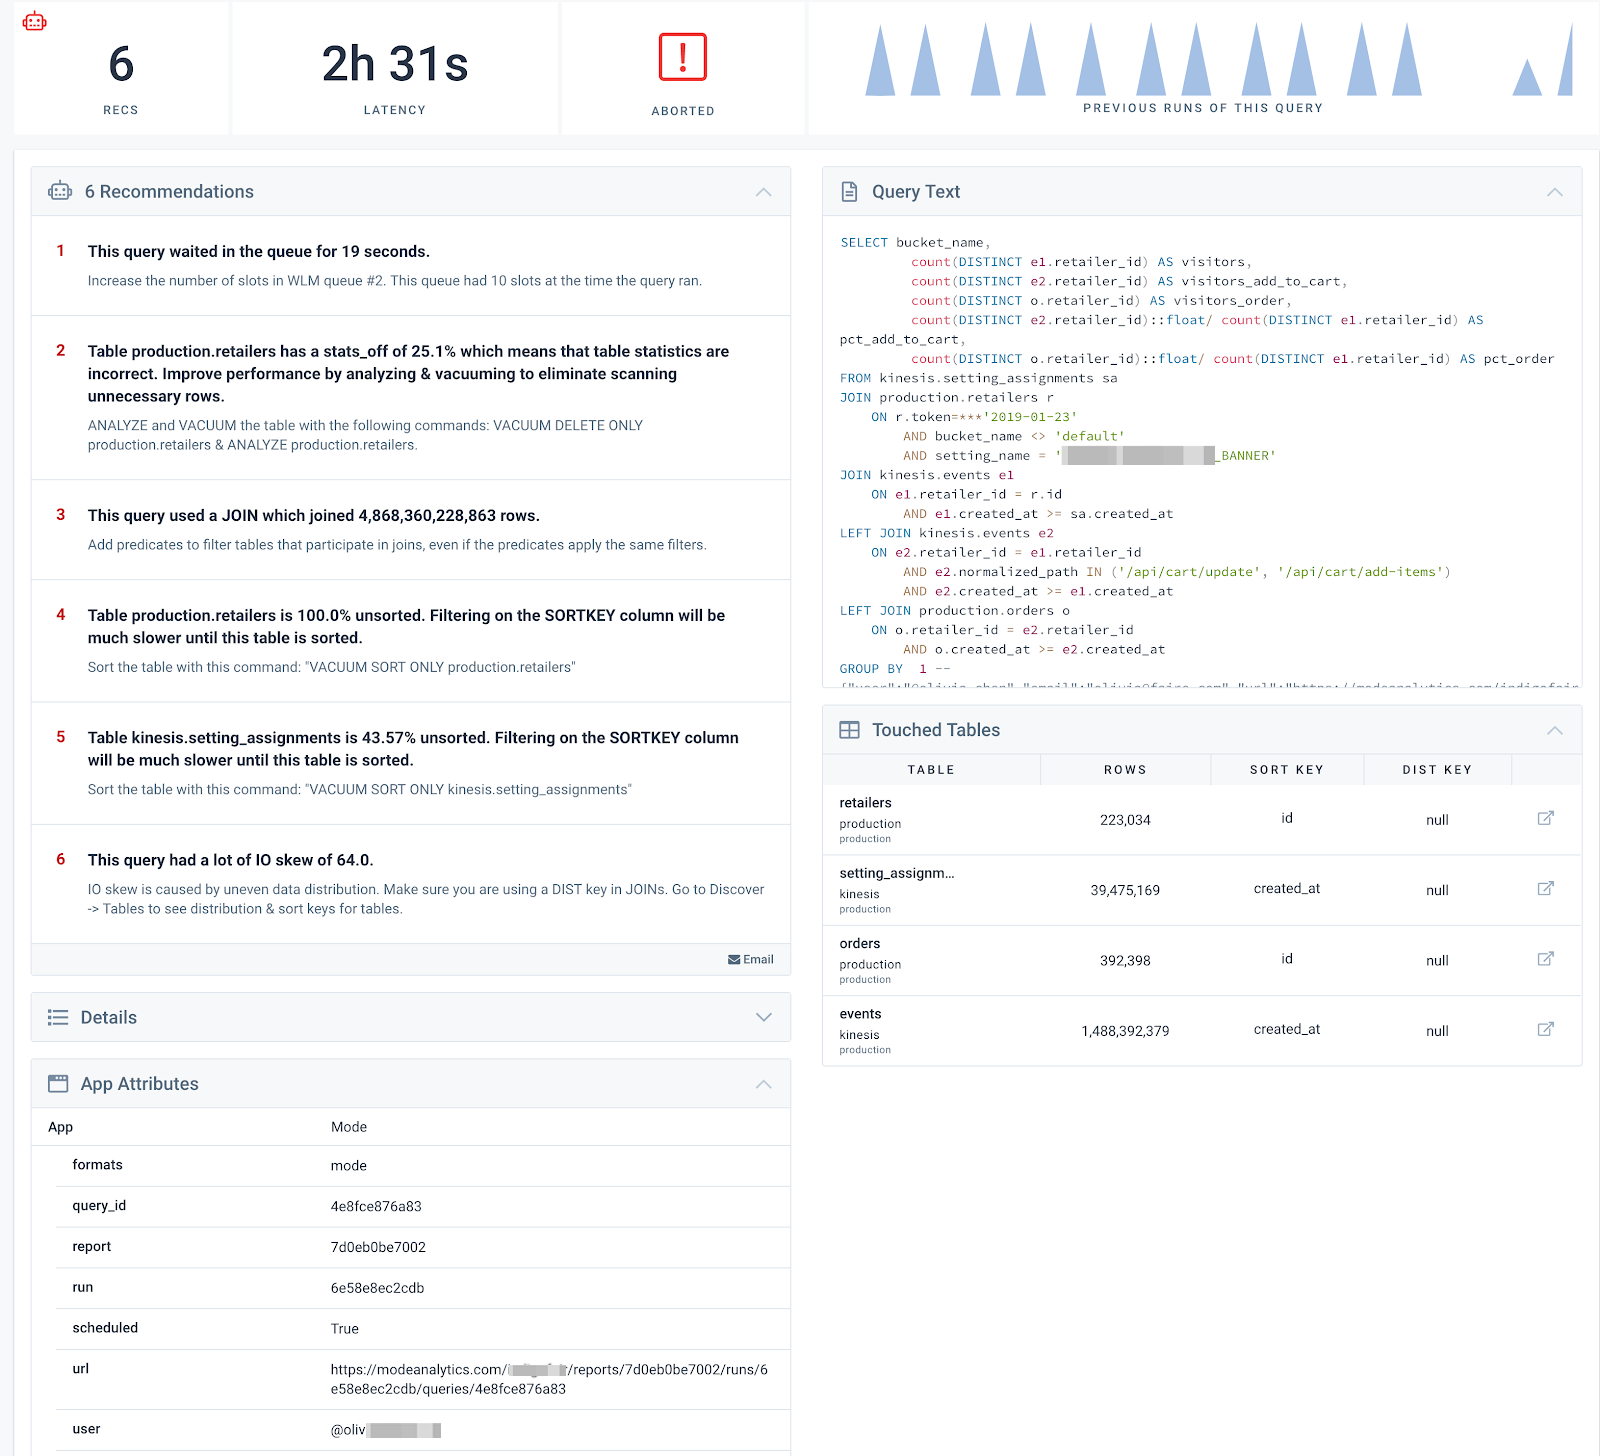
Query Optimization Recommendations
Once you find a query that is taking a long time, drill into the query to get actionable advice on how to re-write it to make it run faster.
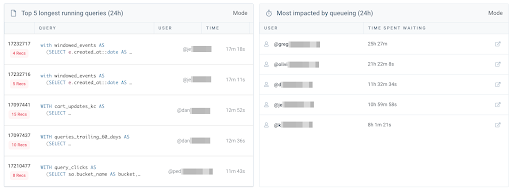
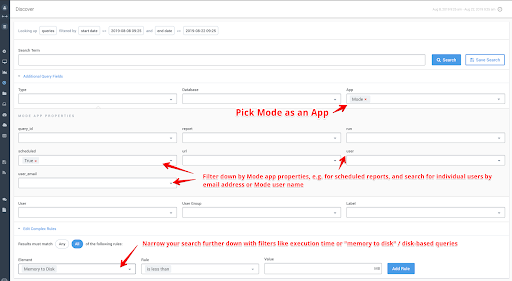
Troubleshoot Slow User, Reports, and Runs
With our Query Insights, you can determine the individual queries that are cause your Mode app along all other users running queries in your warehouse. From there, you can remove users, and filter down by each attribute that Mode provides.
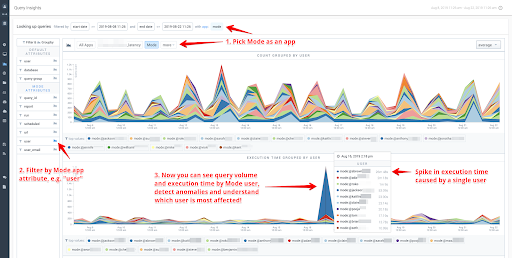
Once you see your problematic queries, easily drill into them to get details recommendations on how to optimize the queries to run faster.
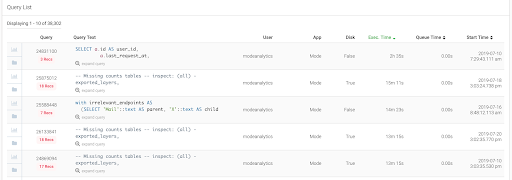
A Complete History
In the intermix.io dashboard, you can search, filter and drill down into that history in a much more human-friendly way than your warehouse console.
Getting Started
You will be able to respond to and fix problems fast, which helps you minimize expensive support requests. It also means that when you turn the lights off at night or go on that camping trip on a Friday – you can put your mind at ease, enjoy the outdoors and catch up on those critical Zs. When you return to your desk on Monday morning, you’ll have the confidence to know what happened over the weekend, and show your stakeholders what you’ve done to improve performance.
The Mode integration is available now, data teams at companies like InVision, WeWork and Faire are using it every day. Join them via signing up for a free trial.

