Computational notebooks for data science have exploded in popularity in recent years, and there's a growing consensus that the notebook interface is the best environment to communicate the data science process and share its conclusions. We've seen this growth firsthand; notebook support in Mode quickly became one of our most adopted features since launched in 2016.
This growth trend is corroborated by Github, the world's most popular code repository. The amount of Jupyter (then called iPython) notebooks hosted on Github has climbed from 200,000 in 2015, to almost two million today. Data from the nbestimate repository shows that the number of Jupyter notebooks hosted on GitHub is growing exponentially:
This trend begs a question: What's driving the rapid adoption of the notebook interface as the preferred environment for data science work?
Inspired by an Analog Ancestor
The notebook interface draws inspiration (unsurprisingly) from the research lab notebook. In academic research, the methodology, results, and insights from experiments are sequentially documented in a physical lab notebook. This style of documentation is a natural fit for academic research because experiments must be intelligible, repeatable, and searchable.
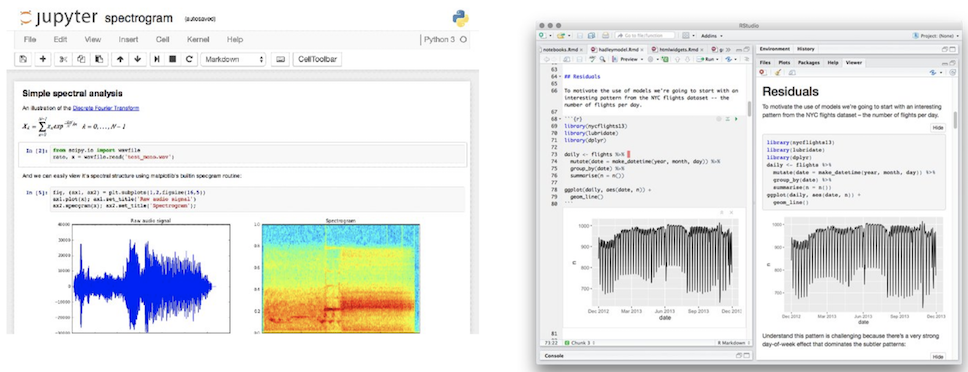
As research began to transition to computational environments, the lab notebook underwent a virtual transformation. The first computational "notebook" interface was introduced almost 30 years ago in the form of Mathematica. Since Mathematica's conception, we've witnessed a proliferation of notebook interfaces, some of which we drew inspiration from for Mode's own notebook interface: Jupyter, MATLAB, R Markdown, and Apache Zeppelin, to name a few.
But what, exactly, differentiates a notebook interface from any other programming environment? What makes it better than the shell, a text editor, or an IDE? While having many differences both visually and linguistically, the current landscape of notebook interfaces all share a common design pattern:
- The ability to independently execute and display the output of modular blocks of code.
- The ability to interweave this code with natural language markup.

So why has this design pattern driven such widespread adoption of the notebook interface in data science applications?
An Extension of The Method
As a scientific practice, data science draws much of its established processes from the scientific method. In her book Doing Data Science, Cathy O'Neill claims that the data science process is really just an extension of the scientific method:
- Ask a question.
- Do background research.
- Construct a hypothesis.
- Test your hypothesis by doing an experiment.
- Analyze your data and draw a conclusion.
- Communicate your results.
Similar to the scientific method, data science is largely an exploratory and iterative process. You deconstruct your problem space into logical chunks worthy of independent exploration and iteratively build towards a more refined and nuanced conclusion. This approach makes it especially important for data science code to be modular and repeatable.
The notebook interface addresses this need by allowing you to break down what would otherwise be monolithic scripts into modular collections of executable code. This enables the user to run code blocks and examine their respective outputs independently from the rest of the notebook. This functionality has become critical for managing cognitive and computational complexity in increasingly elaborate data science workflows.
When examining the differences between the scientific method and Cathy O'Neill's proposed data science process, we see an increased emphasis on one final step; communicating results. In his keynote address at JupyterCon 2017, William Merchan of datascience.com cited a Forrester survey that states that 99% of companies surveyed think that data science is an important skill to develop, yet only 22% of these companies have seen tangible business value from data science.
He goes on to claim that this disconnect between potential and realized business impact stems from the fact that communicating and delivering insight from data science work is becoming nearly impossible to orchestrate. This is because as data science continues to become a more critical function in every industry, the number of stakeholders whose jobs are dependent on the output of data science work continues to increase. As the number of these stakeholders increases, the data literacy gap widens. Effectively delivering and communicating tangible insight from data science work becomes increasingly more challenging for the modern data team.
Show Your Work
The notebook interface addresses the inherent communication challenges in data science by leveraging a style of programming called Literate Programming. Literate Programming is a paradigm in which modular blocks of code are interwoven with blocks of supplementary context and explanation for that code. Donald Knuth, the author of the paper Literate Programming, expounded on this concept when describing his experience developing the WEB programming language and documentation system:
"When I first began to work with the ideas that eventually became the WEB system, I thought that I would be designing a language for “top-down” programming, where a top-level description is given first and successively refined. On the other hand I knew that I often created major parts of programs in a “bottom-up” fashion, starting with the definitions of basic procedures and data structures and gradually building more and more powerful subroutines. I had the feeling that top-down and bottom-up were opposing methodologies: one more suitable for program exposition and the other more suitable for program creation. But after gaining experience with WEB, I have come to realize that there is no need to choose once and for all between top-down and bottom-up, because a program is best thought of as a web instead of a tree. A hierarchical structure is present, but the most important thing about a program is its structural relationships. A complex piece of software consists of simple parts and simple relations between those parts; the programmer’s task is to state those parts and those relationships, in whatever order is best for human comprehension— not in some rigidly determined order like top-down or bottom-up."
The resulting programming environment, optimized for human comprehension, is exactly what has enabled the notebook interface to thrive within the modern data-driven organization. It gives data teams the ability deliver their work with enough exposition and context to be easily understood by consumers on a wide spectrum of literacy levels. This increased attention to the effective delivery of insight is critical in environments where data science output is increasingly a key input to decision making.
In fact, Cathy O'Niell claims that this ability, which she refers to as “translation”, has become a fundamental skill in data science:
"Their fundamental skill is translation: taking complicated stories and deriving meaning that readers will understand."
This is one of the biggest challenges facing modern data teams. In addition to their core scientific and analytical competency, they need to be expert storytellers. This means carefully constructing narratives around their work that will both inform and engage their readers. The notebook interface offers a uniquely advantageous environment for this. By letting data teams construct their analysis and corresponding narrative in the order of their thought process instead of the order dictated by the computer, literate programming lets them tell more informative, engaging, and human stories.
The power of the notebook to help data teams tell their stories more effectively made the decision to offer a native Python notebook within Mode a no-brainer. We're proud to be part of the growth of notebooks.


