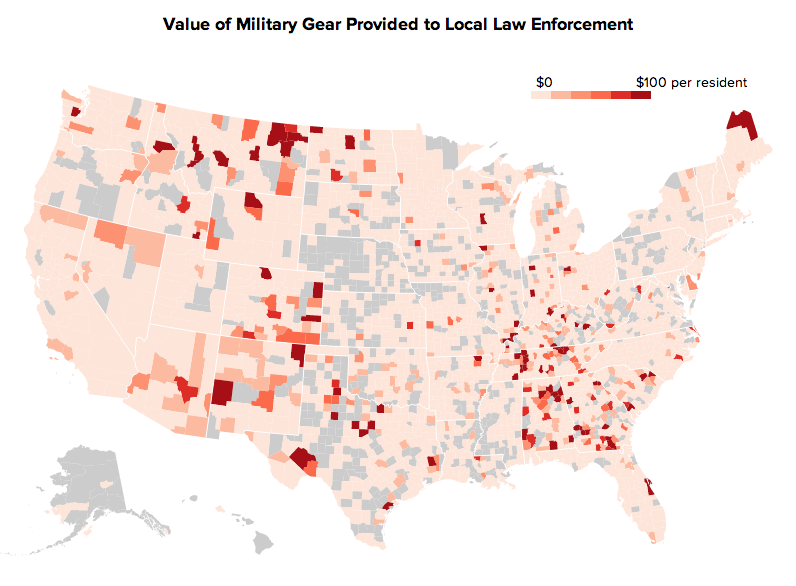
First Tom Giratikanon brought to light the spread of military surplus gear in this alarming New York Times graphic. And then he did something that we're seeing happen with increasing regularity: Giratikanon published all the raw data.
A recent Source article “When the news calls for raw data” covered the process and implications for publishing the data behind the news. The conclusion is significant:
"Whether they’re published immediately as part of the articles they support, or posted later in response to public demand, these stores of raw data add a dimension to major news conversations that one-time analysis alone can’t offer."
Giratikanon and others have typically turned to GitHub to open their data. While GitHub is changing the face of open source software, people are, in essence, hacking its original purpose to get data into the hands of others. There has to be a better way to open up data for analysis.
We envision a place where every related analysis is connected by the data it references and the people who worked together. We believe that projects shouldn't be relegated to disparate desktops with each and every .CSV download. And we know from experience that storing immediately executable code alongside data drives [collaborative analysis](https://mode.com/blog/collaborative-data-analytics/) forward, faster.
We're building the free, public version of Mode because we believe it can help journalists add that new dimension to major news conversations. But we want to start with just that—a conversation. Journalists, newsroom data teams, and data visualization consumers: if GitHub wasn't your default, how would your ideal tool create a collaborative, conversation-starting home for your data? Tell us on twitter with #opennewsdata
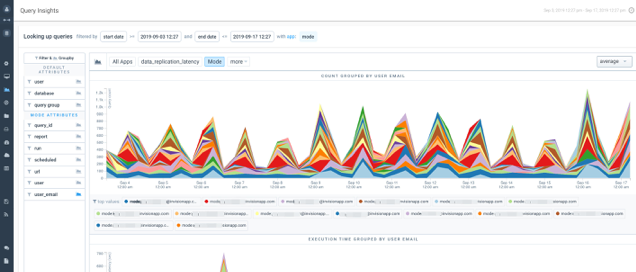
To see Mode's approach in action (we're still in beta), check out how we uploaded the military surplus data, combined it with county population data, and visualized it—without ever leaving the browser, or spinning up a server to host the graphic, which we've then embedded here:


