
More than Spreadsheets
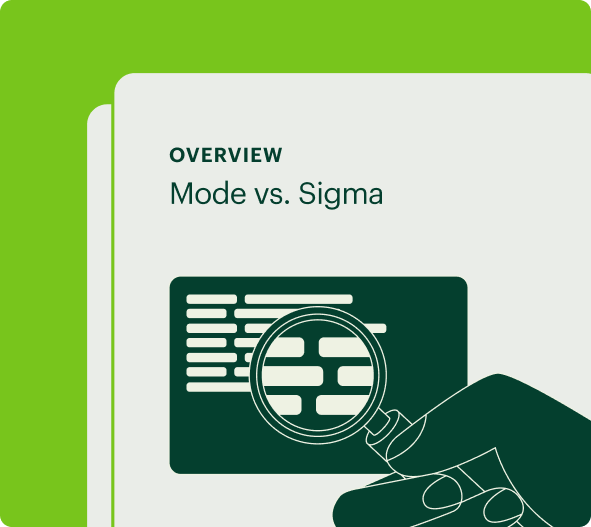
Mode vs. Sigma
Today’s marketplace requires truly modern business intelligence tools that prioritize a user-first choice of analysis including SQL, Python, and R Notebook workflows for everyday analysts in addition to robust visualizations for every team and business user—and all in one place.


One unified platform for everyone
Mode is the only platform that includes starting point options for anyone. Whether it be ad hoc analysis, advanced analytics, custom data apps, interactive dashboards or self-service reporting, Mode’s multi-modal UI empowers collaboration between data analysts and business users alike.
Sigma’s is designed to be a spreadsheet-first point solution. Sigma comes with the time-intensive tax of constantly switching tools to get the work done.
Visual thinkers welcome
Drag-and-drop your way through governed datasets and metrics, iterating through as many visualizations as you need to understand your data and find that aha moment.
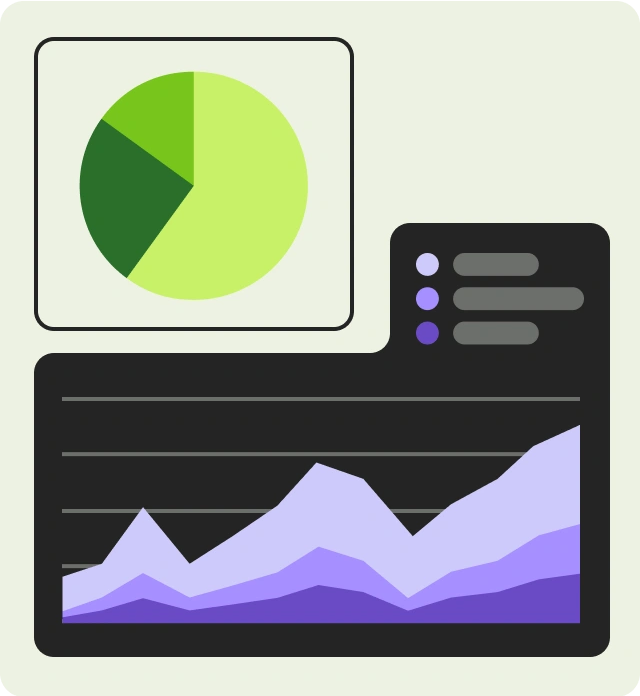
Simple charts
Spin up bar and line graphs, pie charts, pivot tables, and more in seconds.
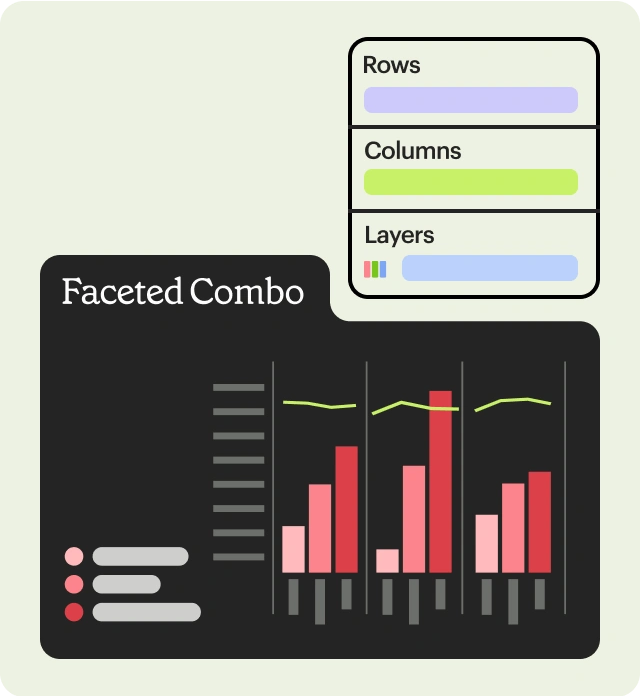
Multi-faceted, multi-dimensional
Building complex charts is possible with drag-and-drop charting visual analysis that is anything but basic.
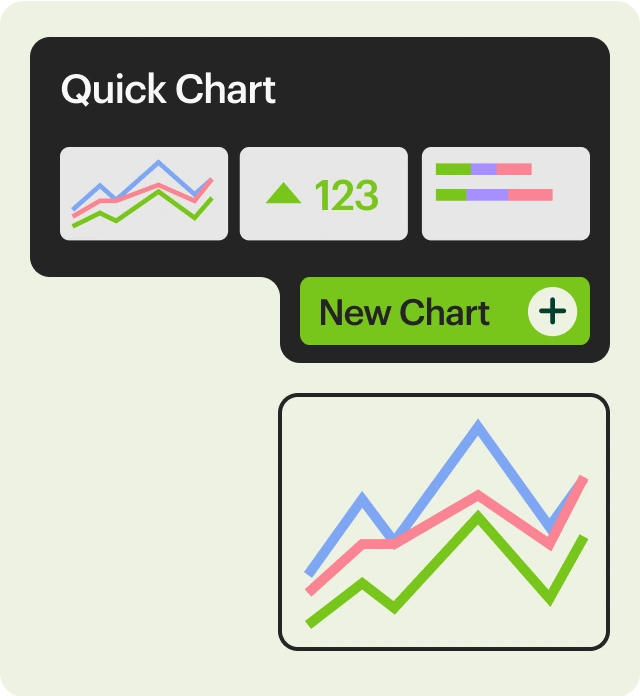
Endless iteration
Visualize your data, then quickly iterate through as many versions of the chart you need to get your point across.

Text write-ups
Don't just share the charts. Give them context with a quick explanation.

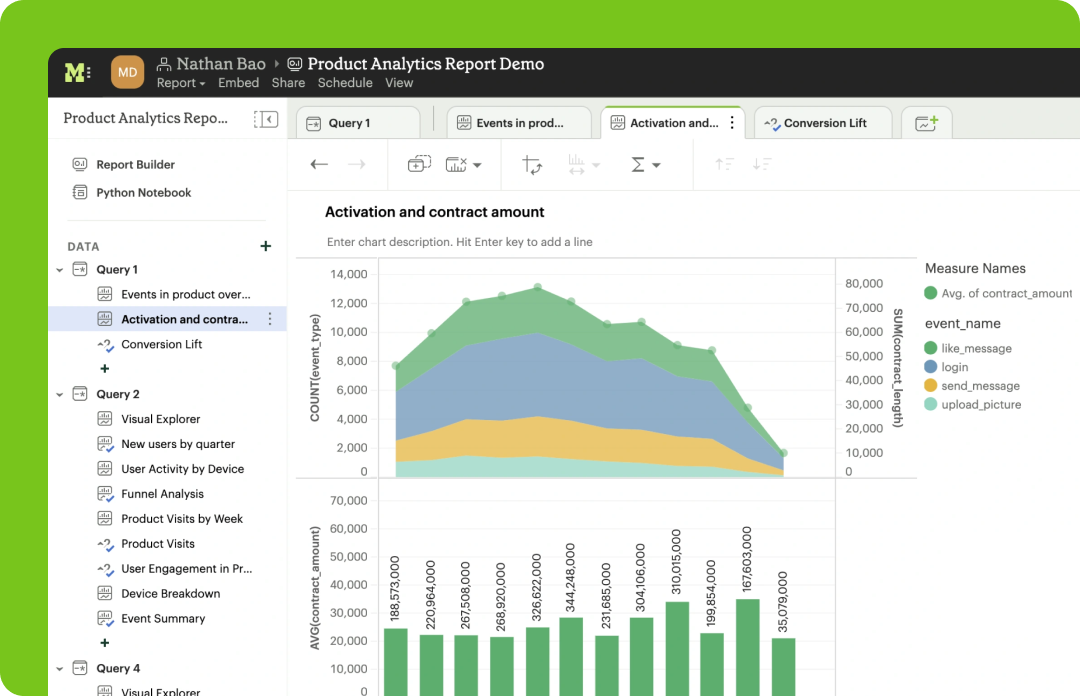
Plenty of charts
Add as many visualizations as you need to monitor your metrics or share your insights.

Automatic refresh
Reports built on datasets are automatically refreshed based on the dataset schedule.

Schedule and share
Schedule once, and don't think twice about automated sharing of your reports over Slack or email.

Always accurate
Reports powered by dbt metrics are 100% accurate, 100% of the time.

Automatically updated
Reports built on curated data sources like datasets and dbt metrics will automatically be updated when any foundational data changes.
A solution that scales
Mode brings the most important technical workflows together so you can extract data with SQL, analyze it in Python and R, visualize results with rich dashboards, and share a range of analytical assets. Additionally, Mode’s in memory data engine Helix is built to cache large datasets in the browser so users can filter, visualize, aggregate, and explore the data without hitting the warehouse every time, allowing you to save money and scale.
Sigma directly pulls data from customers’ cloud data warehouse, so every time someone opens a workbook in Sigma, they are directly hitting their warehouse— costs will increase as you scale.

Powerful visualizations for everyone
With Mode, business users also can explore deeply with powerful drag and drop visualizations, simple charts, Notebook-powered visualizations, and also custom HTML graphs–all from a governed environment via parameters and filters.
Sigma's lack of visualizations and options to programmatically create visualizations slows users down, and makes sharing insights difficult. The ceiling for impactful analysis is higher for both business users and analysts with Mode.
A category leader

87%
ease of use
88%
ease of admin
88%
customization
82%
collaboration and workflow
Mode is modern BI that puts data teams at the center

Data tools for everyone
Fast, easy set up
Iterative ad hoc analysis
Integrated Python & R Notebooks
Advanced analytics
Custom data applications
Explorable dashboards
Robust, flexible visualizations
Self-serve reporting
Centralized data hub
Share with your team how Mode compares to Sigma with this one-page overview

Mode for Early-Stage Startups
If you’re an early-stage organization ready to grow with analytics that scale with you, check out our program where you can get all of Mode at a fraction of the price.
Get more from your data
Your team can be up and running in 30 minutes or less.