
NO Team left behind
Mode vs. Tableau
Today’s marketplace requires truly modern business intelligence tools that prioritize a user-first choice of analysis including SQL, Python, and R-notebook workflows for everyday analysts in addition to robust visualizations for every team and business user.


Truly modern business intelligence
Mode is the only platform built for true iteration. It allows analysts to seamlessly switch between a cloud-based SQL Editor and connected Python notebooks, while empowering business users to create and share visual dashboards and reports.
Tableau’s legacy approach to business intelligence centers highly visual dashboards for non-technical business teams, but misses the mark on core needs and critical functions of a modern data team’s analysts.
Visual thinkers welcome
Drag-and-drop your way through governed datasets and metrics, iterating through as many visualizations as you need to understand your data and find that aha moment.
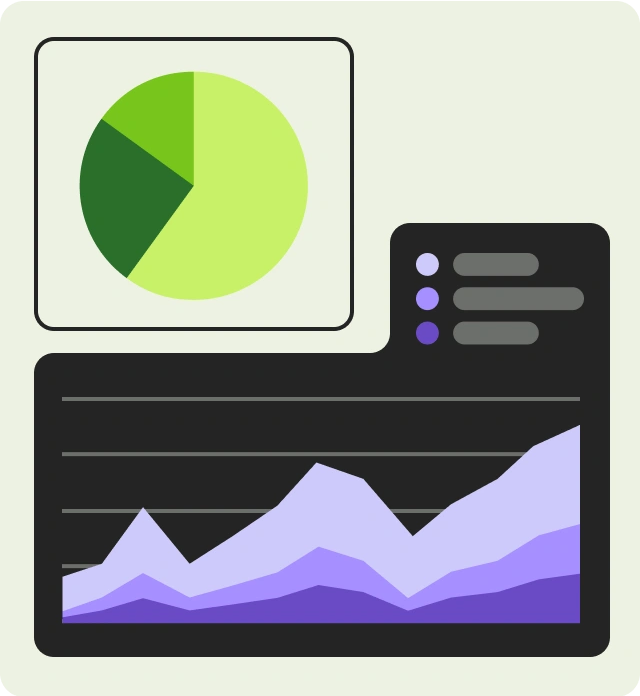
Simple charts
Spin up bar and line graphs, pie charts, pivot tables, and more in seconds.
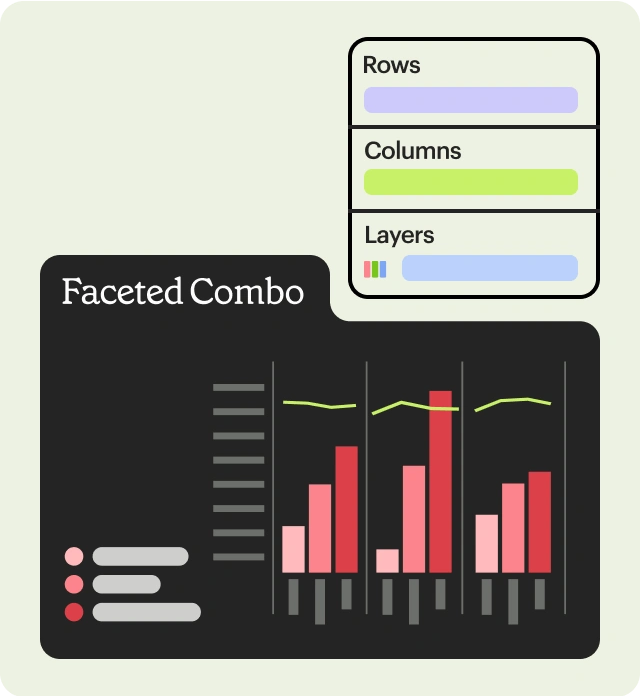
Multi-faceted, multi-dimensional
Building complex charts is possible with drag-and-drop charting visual analysis that is anything but basic.
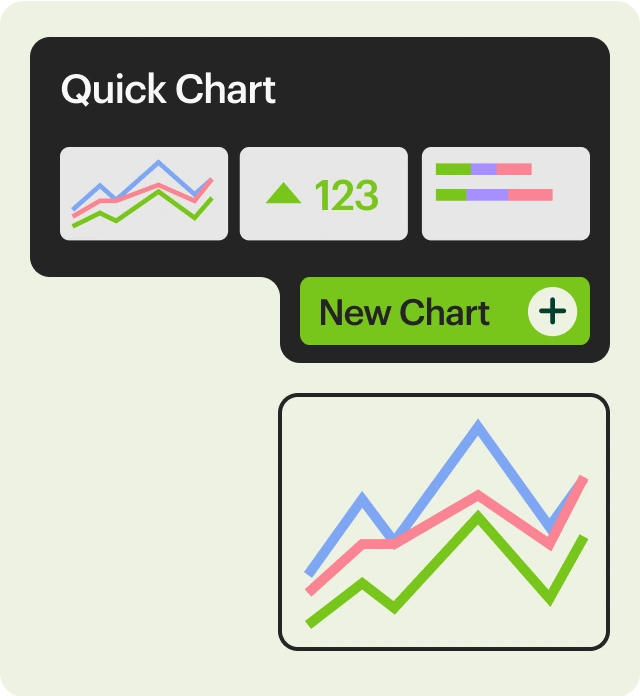
Endless iteration
Visualize your data, then quickly iterate through as many versions of the chart you need to get your point across.

Text write-ups
Don't just share the charts. Give them context with a quick explanation.

Plenty of charts
Add as many visualizations as you need to monitor your metrics or share your insights.

Automatic refresh
Reports built on datasets are automatically refreshed based on the dataset schedule.

Schedule and share
Schedule once, and don't think twice about automated sharing of your reports over Slack or email.

Always accurate
Reports powered by dbt metrics are 100% accurate, 100% of the time.

Automatically updated
Reports built on curated data sources like datasets and dbt metrics will automatically be updated when any foundational data changes.
One unified platform for everyone
Mode’s one-platform approach enables faster speed to insight and is built for true iteration. Analysts won’t suffer from tool switching tax in their workflows and business users can get all the insights they need.
Tableau's data extraction process is cumbersome, time-consuming, and halts iterative analysis. Updating a Tableau Viz with new data requires the user to leave Tableau, prep and load the new data model in their external SQL editor, and possibly change the logic. In addition, standard SQL, Python and R integration is all done outside of Tableau, leading to tool switching fatigue.

Award-winning support
Mode’s award-winning support team quickly resolves issues within an SLA that ensures 99.9% availability every quarter.
With Tableau now seated under Salesforce, the support team is more unresponsive to customers than ever. From setup to everyday issues, many Tableau users are now solely dependent on each other in community forums for troubleshooting and solutions.
Mode is incredibly valuable as a full stack, full-service platform from a data analyst all the way to an end user. Analysts can go deep, end users get the data they need, and our team gets to make everyone a part of the data strategy.


Mode is modern BI that puts data teams at the center

Data tools for everyone
Fast, easy set up
Iterative ad hoc analysis
Integrated Python & R Notebooks
Advanced analytics
Custom data applications
Explorable dashboards
Robust, flexible visualizations
Self-serve reporting
Award-winning support
Centralized data hub

Share with your team how Mode compares to Tableau with this one-page overview
Get more from your data
Your team can be up and running in 30 minutes or less.