
Start fast, stay flexible
Mode vs. Looker
Today’s marketplace requires truly modern business intelligence tools that don’t sacrifice speed, flexibility, power, or results for any team or business contributor.


Faster time to value
With Mode, you’ll never have to sacrifice time to value. Connect directly to your warehouse and start building reports in minutes. With advanced analytics and modern BI combined into one platform, analysts can seamlessly switch between a cloud-based SQL Editor and connected Python & R notebooks to easily iterate and reach insights faster without the time-intensive tax of constantly switching tools.
Looker has a steep learning curve that ultimately slows down time to insights. The dedicated time required to learn a proprietary language, Looker ML, alongside long implementation times and strict governance - means speed to value suffers.
Visual thinkers welcome
Drag-and-drop your way through governed datasets and metrics, iterating through as many visualizations as you need to understand your data and find that aha moment.

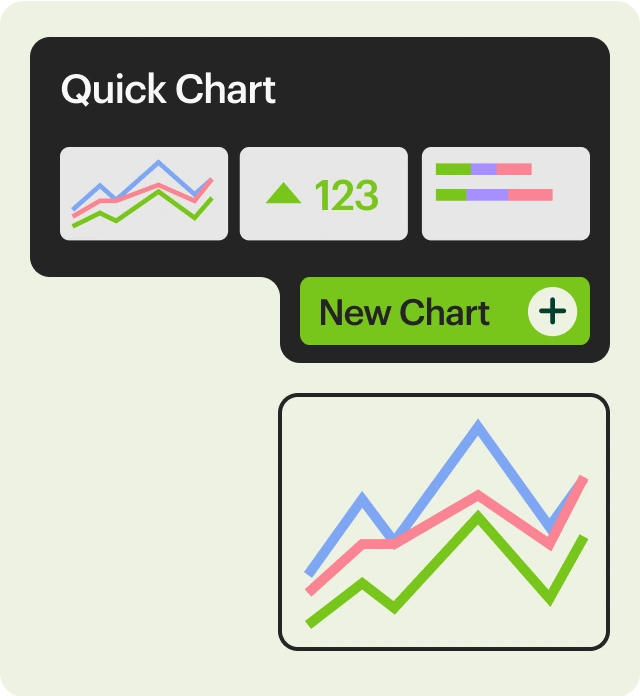
Simple charts
Spin up bar and line graphs, pie charts, pivot tables, and more in seconds.
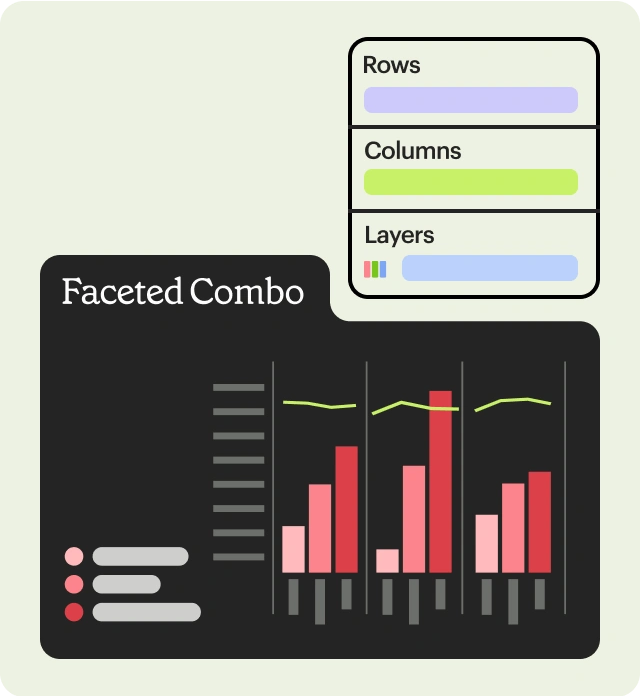
Multi-faceted, multi-dimensional
Building complex charts is possible with drag-and-drop charting visual analysis that is anything but basic.
Endless iteration
Visualize your data, then quickly iterate through as many versions of the chart you need to get your point across.
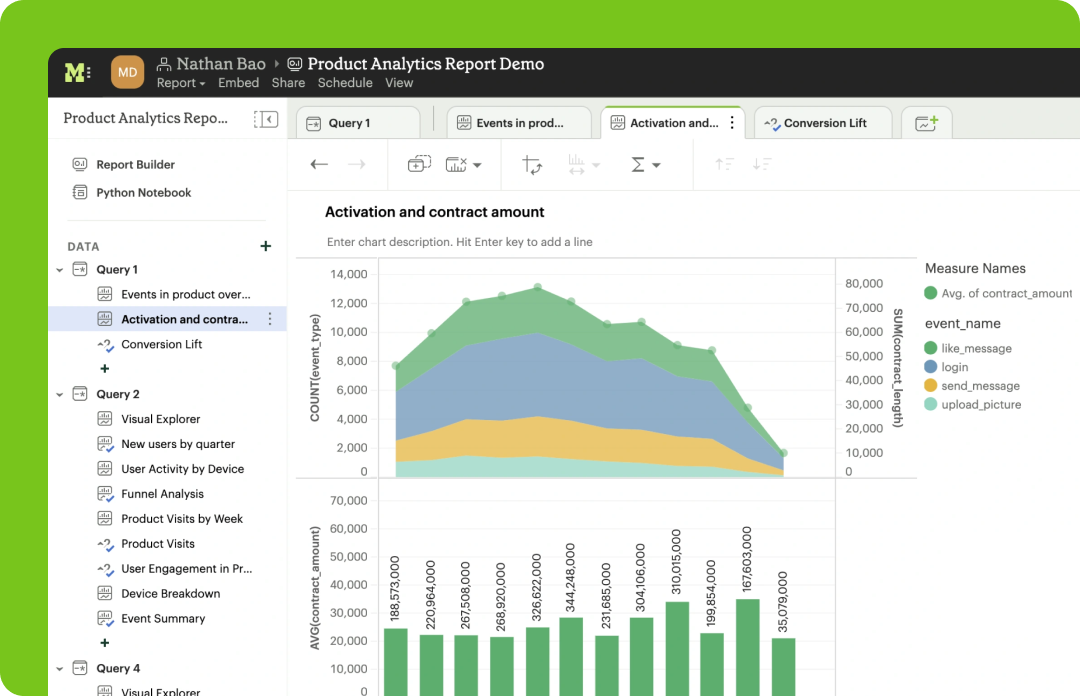
Put it all together
Start with your trusted data, build your visualizations, then share your insights across your organization by building your own one-off report or always-on dashboard with the most relevant data to your team.

Text write-ups
Don't just share the charts. Give them context with a quick explanation.

Plenty of charts
Add as many visualizations as you need to monitor your metrics or share your insights.

Automatic refresh
Reports built on datasets are automatically refreshed based on the dataset schedule.

Schedule and share
Schedule once, and don't think twice about automated sharing of your reports over Slack or email.

Always accurate
Reports powered by dbt metrics are 100% accurate, 100% of the time.

Automatically updated
Reports built on curated data sources like datasets and dbt metrics will automatically be updated when any foundational data changes.
Flexibility first
Mode empowers businesses to balance flexibility and control when analyzing and exploring their data. Flexibility allows for businesses to quickly adapt when their assumptions change, or when original analysis needs further exploration. Anyone can answer strategic questions without hitting a modeling layer or losing time in proprietary language.
Looker’s UI and data governance lacks flexibility. There are strict limitations to who can query data, and hurdles to data exploration beyond what has been defined by the data teams.

Award-winning support
Mode’s award-winning customer support team is dedicated to helping customers solve problems and find success. With Mode self-serving answers is always an option, but humans are nearby for more complex needs. With Looker, customers are left with docs and help articles to find all the help they need.
Mode enabled us to quickly run queries or models in Python or R, and immediately visualize the results. This helps us quickly identify patterns and outliers as we go.


Mode is modern BI that puts data teams at the center
Data tools for everyone
Fast, easy set up
Iterative ad hoc analysis
Integrated Python & R Notebooks
Advanced analytics
Custom data applications
Explorable dashboards
Robust, flexible visualizations
Self-serve reporting
Award-winning support
Centralized data hub
Share with your team how Mode compares to Looker with this one-page overview
Get more from your data
Your team can be up and running in 30 minutes or less.