
Python Tutorial
Learn Python for business analysis using real-world data. No coding experience necessary.
Start Now
Mode Studio
The Collaborative Data Science Platform
The SQL Tutorial for Data Analysis
This tutorial is designed for people who want to answer questions with data. For many, SQL is the "meat and potatoes" of data analysis—it's used for accessing, cleaning, and analyzing data that's stored in databases. It's very easy to learn, yet it's employed by the world's largest companies to solve incredibly challenging problems.
In particular, this tutorial is meant for aspiring analysts who have used Excel a little bit but have no coding experience.
In this lesson we'll cover:
- How the SQL Tutorial for Data Analysis works
- What is SQL?
- How do I pronounce SQL?
- What's a database?
- Get started with SQL Tutorial
Though some of the lessons may be useful for software developers using SQL in their applications, this tutorial doesn't cover how to set up SQL databases or how to use them in software applications—it is not a comprehensive resource for aspiring software developers.
How the SQL Tutorial for Data Analysis works
The entire tutorial is meant to be completed using Mode, an analytics platform that brings together a SQL editor, Python notebook, and data visualization builder. You should open up another browser window to Mode. You'll retain the most information if you run the example queries and try to understand results, and complete the practice exercises.
Note: You will need to have a Mode user account in order to start the tutorial. You can sign up for one at mode.com.
What is SQL?
SQL (Structured Query Language) is a programming language designed for managing data in a relational database. It's been around since the 1970s and is the most common method of accessing data in databases today. SQL has a variety of functions that allow its users to read, manipulate, and change data. Though SQL is commonly used by engineers in software development, it's also popular with data analysts for a few reasons:
- It's semantically easy to understand and learn.
- Because it can be used to access large amounts of data directly where it's stored, analysts don't have to copy data into other applications.
- Compared to spreadsheet tools, data analysis done in SQL is easy to audit and replicate. For analysts, this means no more looking for the cell with the typo in the formula.
SQL is great for performing the types of aggregations that you might normally do in an Excel pivot table—sums, counts, minimums and maximums, etc.—but over much larger datasets and on multiple tables at the same time.
How do I pronounce SQL?
What's a database?
From Wikipedia: A database is an organized collection of data.
There are many ways to organize a database and many different types of databases designed for different purposes. Mode's structure is fairly simple:
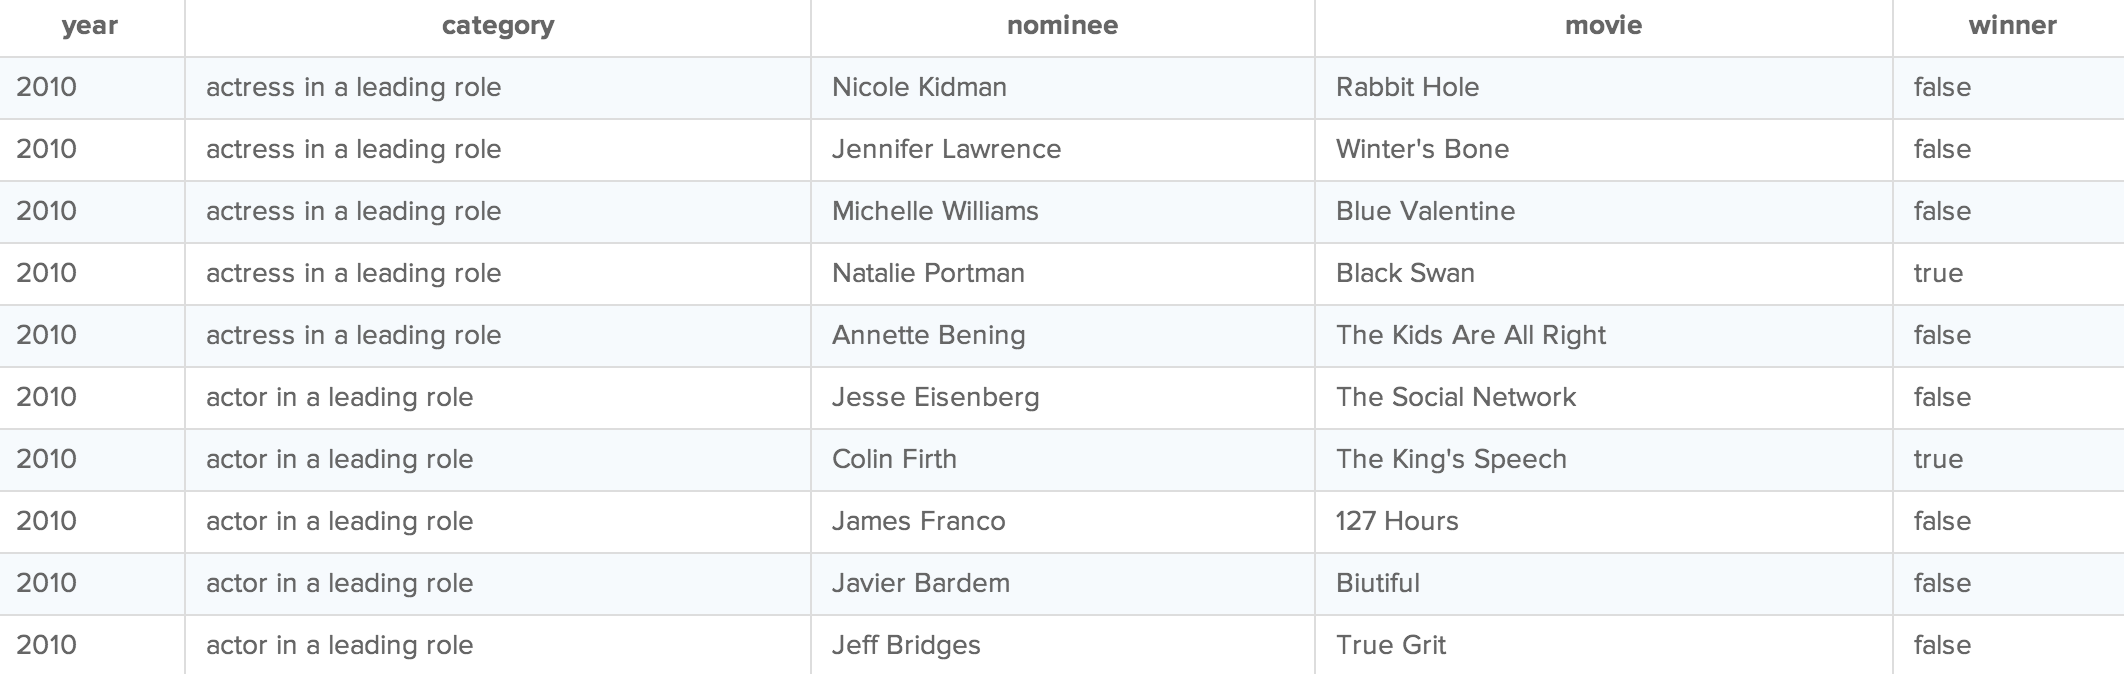
If you've used Excel, you should already be familiar with tables—they're similar to spreadsheets. Tables have rows and columns just like Excel, but are a little more rigid. Database tables, for instance, are always organized by column, and each column must have a unique name. To get a sense of this organization, the image below shows a sample table containing data from the 2010 Academy Awards:
Broadly, within databases, tables are organized in schemas. At Mode, we organize tables around the users who upload them, so each person has his or her own schema. Schemas are defined by usernames, so if your username is databass3000, all of the tables you upload will be stored under the databass3000 schema. For example, if databass3000 uploads a table on fish food sales called fish_food_sales, that table would be referenced as databass3000.fish_food_sales. You'll notice that all of the tables used in this tutorial series are prefixed with "tutorial." That's because they were uploaded by an account with that username.
You're on your way!
Now that you're familiar with the basics, it's time to dive in and learn some SQL.
Next Lesson
Using SQL in Mode